📓 1.1.2.5 Debugging HTML and CSS
Learning to debug is an essential skill to pick up early on. There are many debugging techniques. Here are a few tools that are very helpful for debugging HTML & CSS.
We use Google Chrome at Epicodus so we will focus on Chrome's Developer Tools, also known as DevTools. Other browsers like Firefox also have developer tools. Feel free to look into these on your own if you are interested.
JavaScript Console
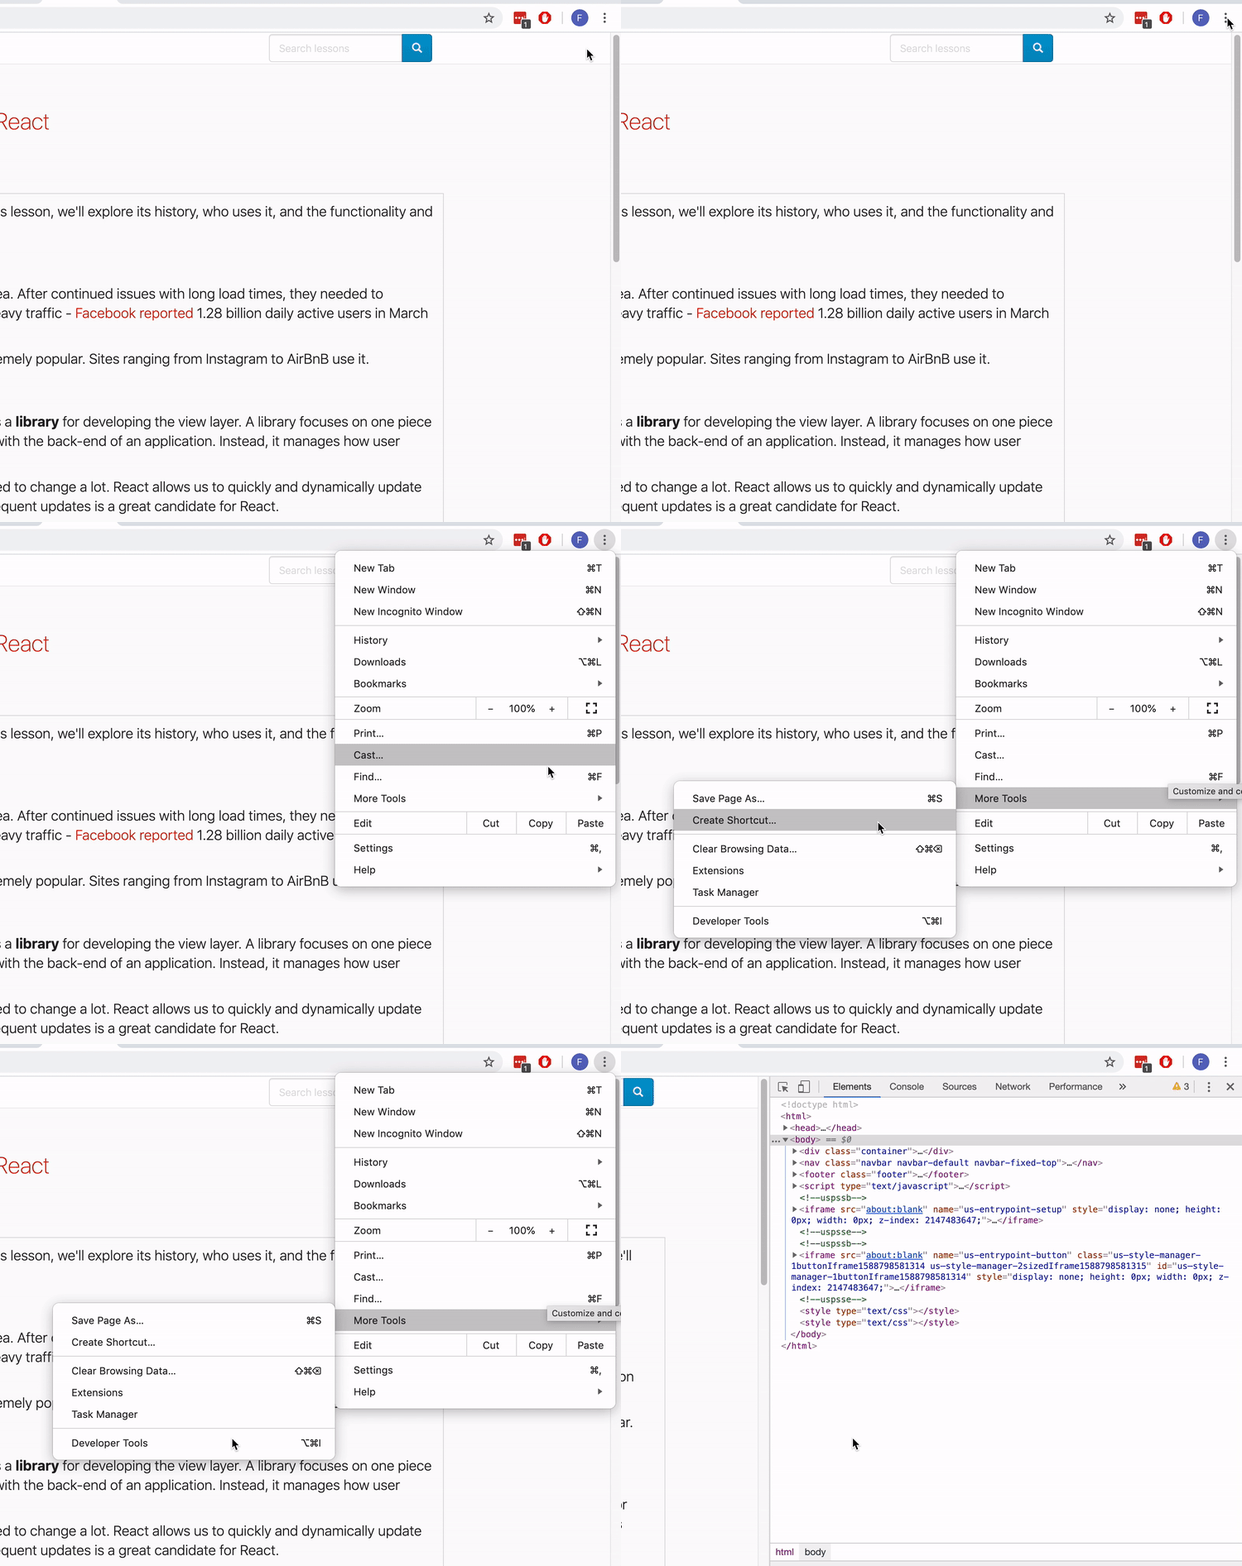
In Chrome, click on the menu button. It's on the right side of the address bar and looks like ☰ in older versions of Chrome or three vertical dots in newer versions. Click More Tools and then click Developer Tools.

As a shortcut, you can also press Cmd + Option + J ( Windows + Alt + J on Epicodus keyboards) to open DevTools.
Next, let's take a look at the DevTools window.

As the image above shows, there are a number of different tabs in the DevTools window. We will regularly use the Elements and Console tabs throughout the program. While the other tabs (such as Sources and Network) also contain useful information and can be helpful for debugging, we won't use them as much.
The Console tab is selected in the image above. This is the JavaScript console where all errors in our web page are logged. We aren't using JavaScript yet but the console will also show us descriptive errors that can be helpful now. For instance, if your CSS file isn't properly linked, you'll see an error message that looks like this one:

The error reads Failed to load resource: net::ERR_FILE_NOT_FOUND. Then, on the right side of the error message, it reads styles.css:1.
This is a very common error, especially for beginners. It simply states that a file can't be found. The name of the file is on the right side of the error message: styles.css. There is also a line number to the right of the file name (1 in this case). Sometimes this is helpful and correctly points to a line number in a file where an error can be found. Sometimes, it's not accurate because of the way Chrome compiles JavaScript. In this case, Chrome can't find a styles.css file so the line number isn't relevant.
The error above can mean one of several things:
- The file doesn't exist.
- The file exists but there's a typo in either the file name or in the code referencing the file (for instance, if we'd accidentally named the file
style.cssinstead ofstyles.css). - The file exists but it's in a different directory than the one specified.
You will likely see this error many times — not just as a student but even as an experienced developer. The exact same error will come up with other file types, too, not just CSS files. You can follow the steps above to fix the issue.
The Elements Tab
We can also see the elements on an individual page. Click on the Elements tab in DevTools and we'll see a list of all the elements ranging from p tags to divs and so on.

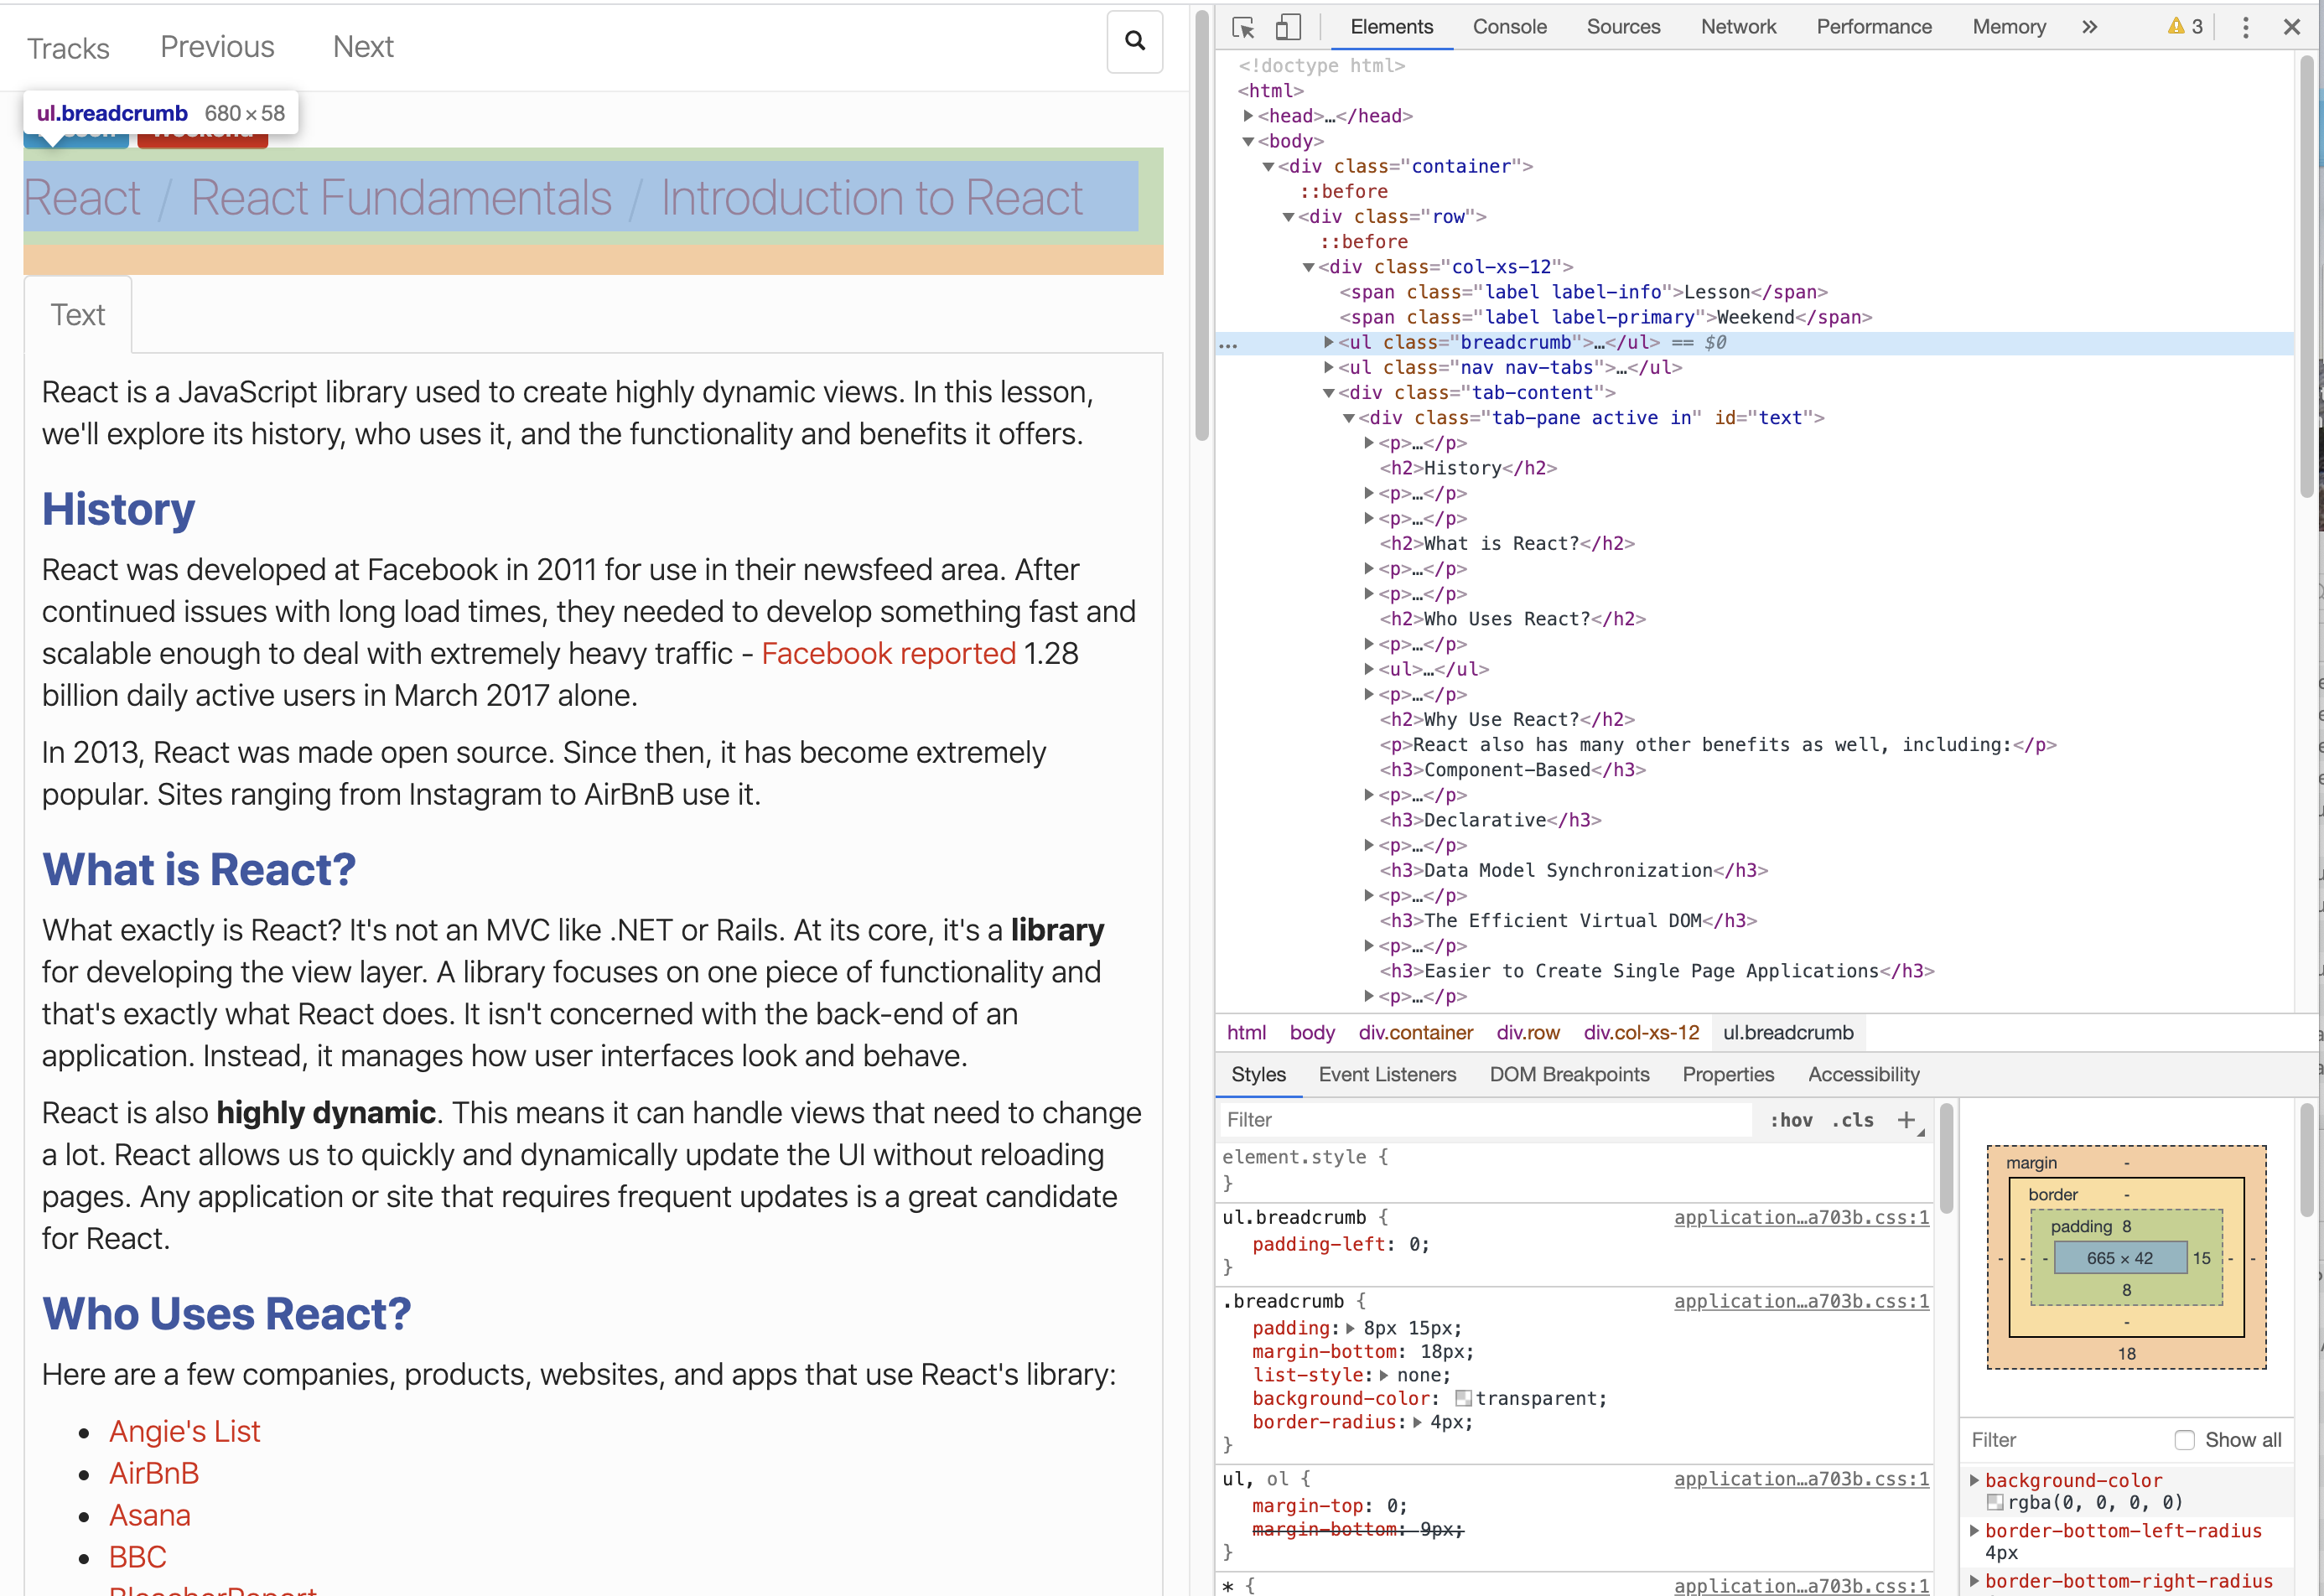
In the image above, the Elements tab is open. We've clicked on an unordered list element with a class of breadcrumb. Clicking on this element highlights the actual element on the page.
We can see that this unordered list is a child of a div. We could also expand this class to see all of its children. In fact, another div class on the page has already been expanded to show its children — a group of p tags.
Finally, below the elements pane, there is another pane in the bottom right corner that show us exactly which CSS styles apply. These are applied from highest specificity to lowest. In the image above, the most specific CSS rule is ul.breadcrumb, which has a property of padding-left: 0;.
The least specific rule is ul, ol. Note that the margin-bottom property here is crossed out. This is because the rule has been overridden by the margin-bottom property in the more specific CSS rule just above ul, ol called .breadcrumb.
As you can imagine, this is a great tool to debug CSS styles. If a style isn't showing up, it's possible that another rule is overriding it. The Styles pane will show this. It's also possible that a CSS property isn't being applied even though you think it is. The Styles pane is a great place to find out.
Editing CSS in the Browser
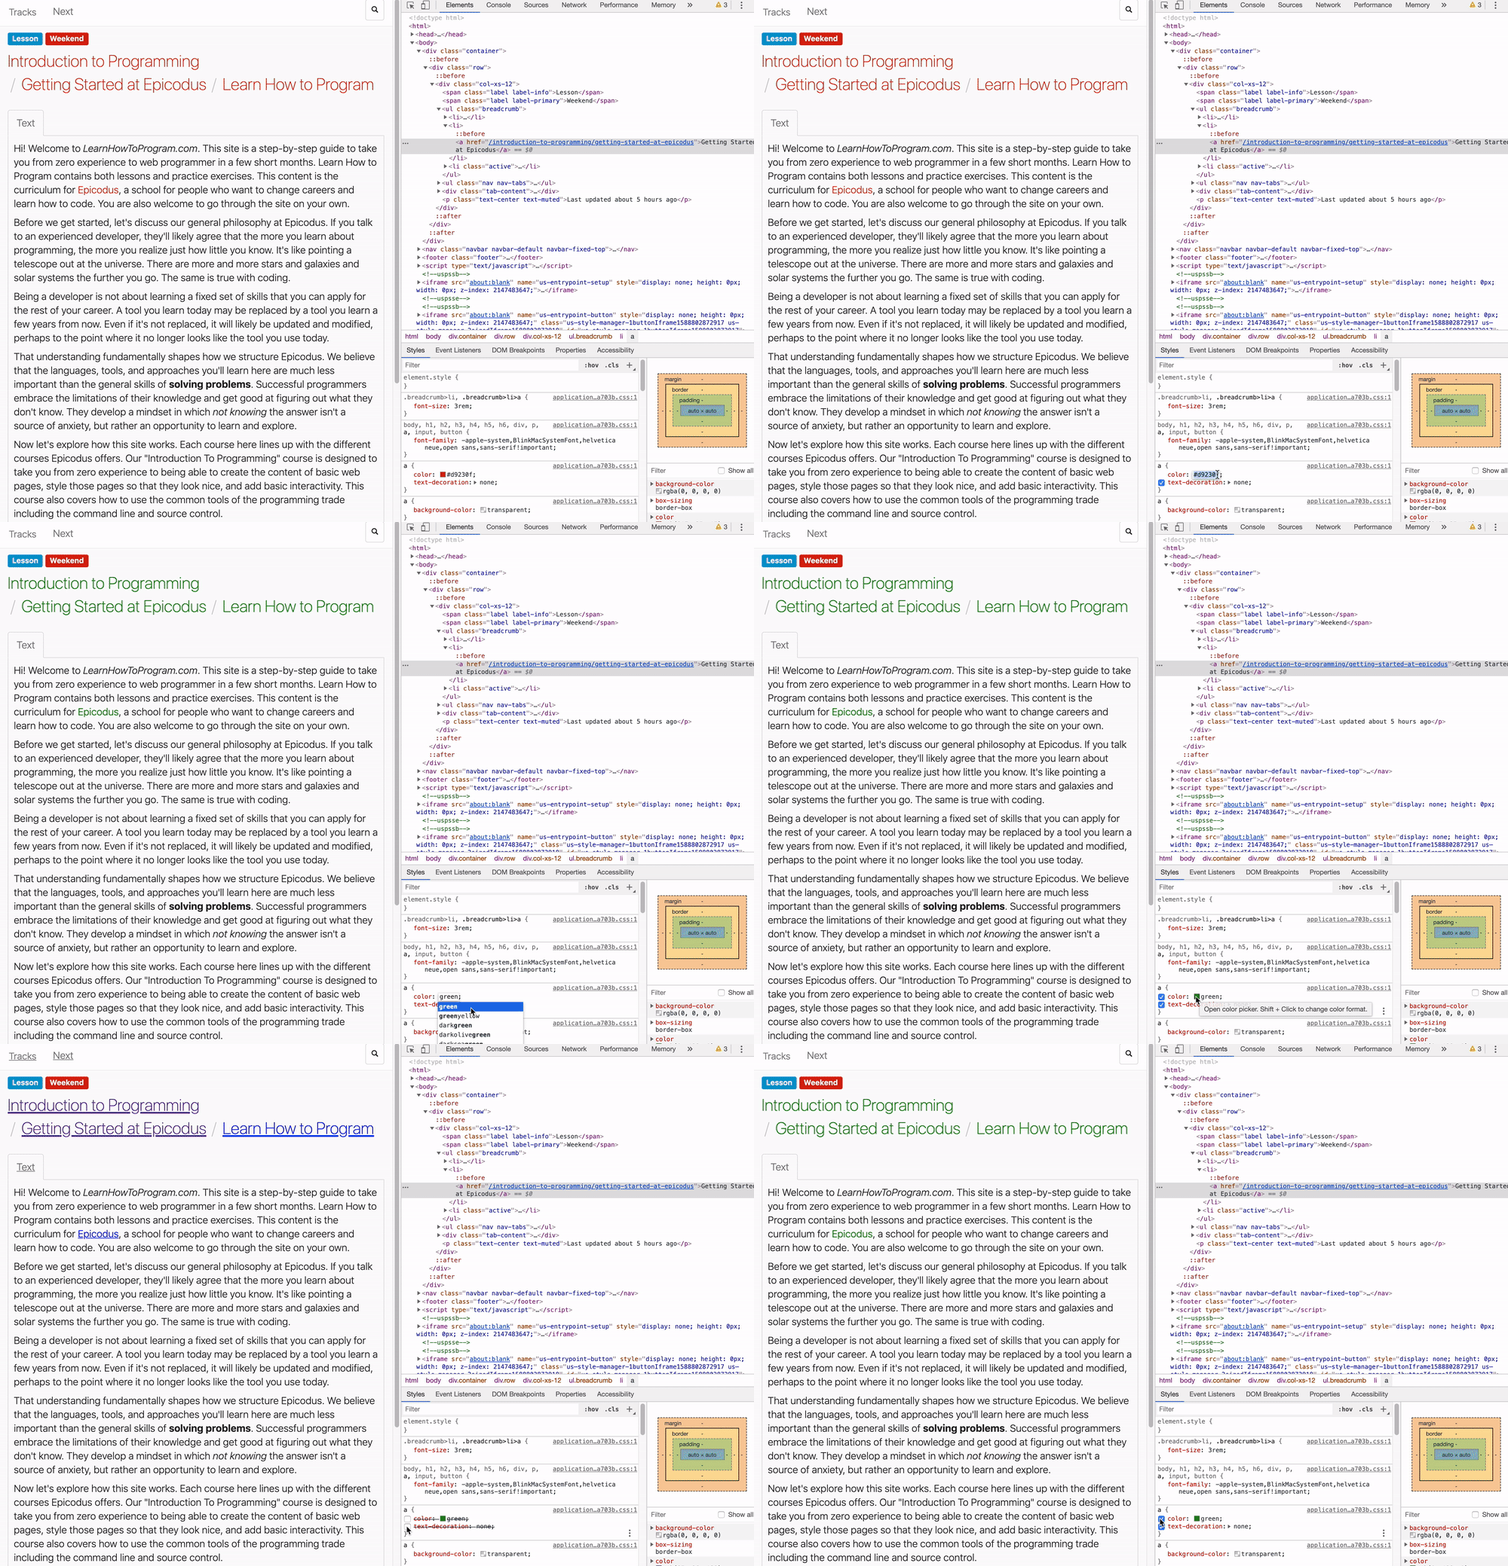
Here's another really cool thing we can do — we can actively edit our CSS in the browser without changing it in our code. This allows us to experiment with changing styles. Check out the GIF below.

We've already highlighted the element that holds the tile "Introduction to Programming / Getting Started at Epicodus / Learn How to Program." Let's say we want to see how this heading looks with a different color.
We can click the checkbox to the left of the property in the Styles pane. When the checkbox is clicked, the property is applied. When it's unclicked, the property is removed.
We can also update a property. In this case, we click on the color and change it to green.
We could even add a new property if we like — just start a new line in the CSS rule and add the property! (This isn't shown in the GIF above.)
These changes aren't permanent — they are just revisions to the DOM we see. If we refresh the page, we'll see any changes we make are undone.
We can do this to any webpage. Pick out a site you really like (or just do this lesson) and try changing some rules on your own. It's a great way to experiment!
Inspecting Elements
We can also inspect individual elements on a page. This trick is especially useful for debugging HTML and CSS. Let's take a look at the DevTools menu again. Start by clicking on the Elements tab (if you're not already on it).
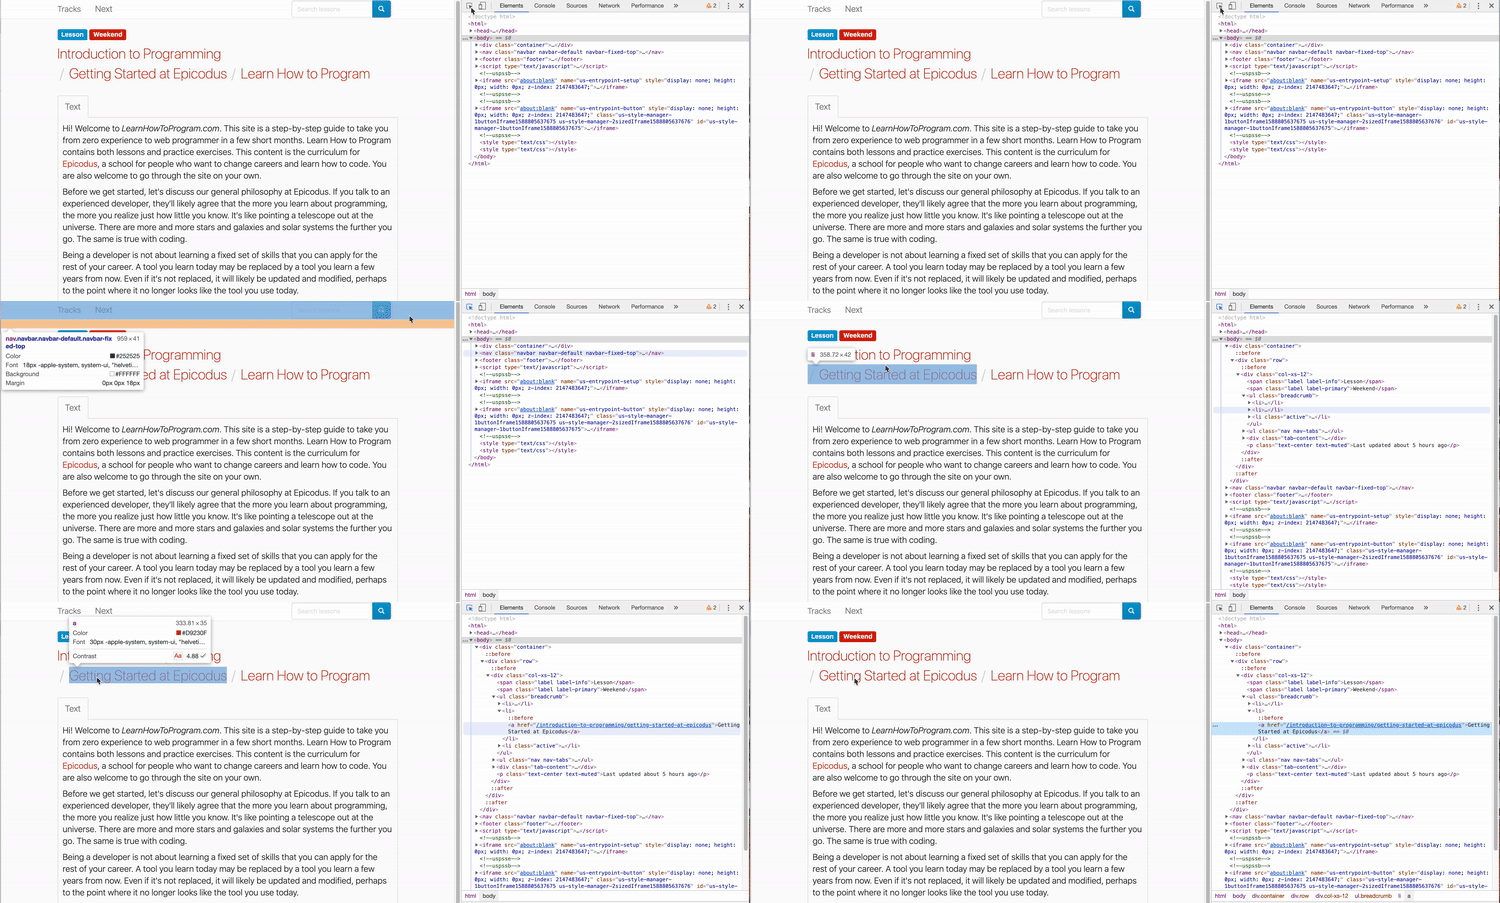
On the far left, we'll see a square with an arrow icon on it. The icon will generally be gray, but we can click on it to activate the inspect element tool. (It will turn blue when it's activated.) The GIF below shows the inspect element tool in action.

Once we activate the tool, we can hover over any element on the page to see the CSS rules that apply to it. If you look at the graphic above, you'll see how the information changes as we hover over different elements. We see the new CSS rules on the left and we see the specific element on the right (in the Elements panel).
As we can see, we can target specific elements either by clicking them in the Elements pane or by clicking the inspect tool and then clicking on them in the DOM.