📓 1.2.1.8 Debugging in JavaScript: Reading Console Errors
One of the most important parts of being a developer is debugging. We'll often run into bugs in our code — and the code of others, too. Fortunately, there are many tools at our disposal for debugging JavaScript code. During this course section, we will cover four commonly used tools that can help you narrow down the source of your bugs:
- Looking for errors in the DevTools console
- Pausing on exceptions
- Using
console.log;to log values in our code - Using
debugger;and breakpoints to freeze our code
We've looked in the DevTools console for errors before — such as when we learned how to see if our project can't find a CSS file in the Debugging HTML and CSS lesson. However, the other three tools are new.
In this lesson, we'll revisit a key debugging technique: looking for errors in the DevTools console.
Checking the DevTools Console
Whenever we are running JavaScript in the browser and something isn't working correctly, the first step is always to open the DevTools console. Too often, when an instructor comes by to help a student debug, we've found that the console isn't even open. That's a surefire sign that the student hasn't done any debugging — which means it's time for the instructor to walk away and allow the student to actually spend time honing this absolutely essential skill.
When we open the console, any glaring errors will show up in red with an X to the left of the message. Meanwhile, warnings will show up in yellow. Generally, warnings won't break our code but they will include messages suggesting something in our code is deprecated or not ideal. Throughout this program, we will ignore warnings. Messages in the console that are red must be addressed.
Sometimes errors can be tricky and not show up as an error, but instead an undefined value. Since we'll be working with the DevTools console quite a bit to test our code, let's look at two examples of errors that can show up in our code.
Uncaught ReferenceError
If we open up the DevTools console and enter in the following code, we'll get an error:
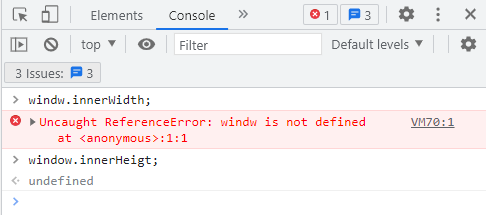
> wndow.innerWidth;
Uncaught ReferenceError: wndow is not defined at <anonymous>:1:1  VM70:1
As we can see in the image, we can tell that this is an error because the message is in red and there's an X to the left of the message. We can also see that it's an error, because it states ReferenceError. JavaScript has a handful of built-in errors that it prints in the console when our code breaks. You'll know that it's a built-in error because the error message begins with "Uncaught <NameOf>Error: ...":
Uncaughtmeans the error hasn't been addressed and the error is breaking your code.<NameOf>is the name of the error.
You'll learn about different types of errors as they come up, but you can also see a list of these errors on MDN.
A helpful first step in resolving an error is to research it so you can understand what type of error you are dealing with. According to MDN, a ReferenceError is:
an error when a variable that doesn't exist (or hasn't yet been initialized) in the current scope is referenced.

If we revisit our error message, we should quickly see the issue in the error message wndow is not defined: we have a typo! We wrote wndow instead of window, and the variable wndow doesn't exist in our code (we didn't create it and it's also not built-in). Encountering an error that's caused by a typo is incredibly common among computer programmers new and old.
Sometimes typos don't even cause errors, which can become very tricky bugs to fix. That's what we can see with the second statement we typed into the console.
Getting undefined Returned When You Expect Otherwise
Let's look at the next example bug (as seen in the above image) when we typed this code:
> window.innerHeigt;
undefined
Here we're trying to access the innerHeight property of the window object, but we're only getting undefined returned to us. While this isn't an error, this is still helpful information for debugging. If we are expecting a certain outcome from the code we write and we don't get it, the first place we should always look is the code that we just typed. Indeed when we review our code window.innerHeigt;, we should see that there's a typo in the property name: a missing h in innerHeigt. Often in these cases it takes someone else's eyes to spot the typo!
Even though there's clearly an error in our code, JavaScript won't give us an error message in this case because window.innerHeigt; is the correct syntax for creating a new property called innerHeigt that belongs to the window object. JavaScript just can't know what we intended, and it can't differentiate between a typo and the creation of a new property.
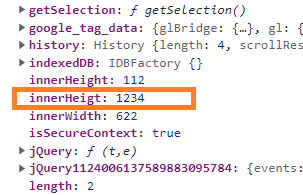
We can confirm that we can add a new property to the window object by giving our innerHeigt property a value and looking for it in the window object:
> window.innerHeigt = 1234;
> window;
Window {0: Window, 1: Window, window: Window, self: Window, document: document, name: '', location: Location, …}

So, remember to always work with your DevTools console open and keep an eye out for error messages! If something is wrong and there is no error message, a helpful starting point is to compare what you expect from the code you wrote to the actual result. This can give you ideas of where to look in your code for the error. Generally speaking, retracing your steps is always helpful when debugging an error in your code.
Later in this course section, we'll learn how to use more powerful debugging tools that will make resolving undefined values even easier.