📓 1.2.4.6 Debugging in JavaScript: Pausing on Exceptions
In this lesson, we'll cover a new debugging tactic: pausing on exceptions. This involves configuring web browser DevTools to automatically pause our code whenever it hits an exception. An exception is just a slightly fancier name for an error. Exceptions are divided into two groups: uncaught/unhandled and caught.
An uncaught exception or unhandled exception is an error that our code doesn't "catch" or "handle". When an error happens in our code that we don't respond to, it stops the function of our application and breaks our code. Here's a simple example of an uncaught error that we can create in our DevTools console:
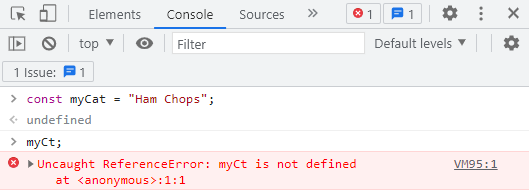
On the other hand, a caught exception is an error that we've predicted may happen in our code and that we've already written code to specifically respond to. We learned about error handling with else statements in the "More Branching" lesson. Remember the following if/else statement from the Amusement Park webpage? This code checks the age and height of a user and displays only the rides they are allowed to ride.
if (age && height) {
  if (age >= 12 && height >= 60) {
    document.getElementById("swings").removeAttribute("class");
    document.getElementById("coaster").removeAttribute("class");
    document.getElementById("tower").removeAttribute("class");
  } else if (age >= 12 || height >= 48) {
    document.getElementById("swings").removeAttribute("class");
    document.getElementById("coaster").removeAttribute("class");
  } else if (age >= 6) {
    document.getElementById("swings").removeAttribute("class");
  } else {
    document.getElementById("sorry").removeAttribute("class");
  }
} else {
  document.getElementById("error-message").removeAttribute("class");
}
The error handling we added is to handle when a user does not input their age or height into the form. If a user leaves either form field blank, the error message will be displayed to them. When this error happens, it's considered a caught exception, because it is an error that's been handled.
The error handling we've learned about is limited, and we will revisit JavaScript error objects and error handling tools in later course sections. Right now, our goal is to develop robust debugging skills. Let's now return to our Calculator project to learn how to configure DevTools to pause on exceptions.
In the practice prompt following this lesson and the next (also on debugging), you'll have an opportunity to practice using these debugging tools in a brand new project (not the Calculator project). Consider whether it's better for you to read along with the lessons, or to code along. If you do want to code along, the HTML and JS (including the bugs) are below for you to use.
Project Setup
We'll use the following code to demonstrate how to use the DevTools to pause on exceptions. This code is taken from the Calculator project, after we've updated it to use branching and radio buttons. Take note: we've introduced an error to the JS in scripts.js. We've also added <br /> tags to the HTML form.
<!DOCTYPE html>
<html lang="en-US">
<head>
  <title>Calculator</title>
  <link href="css/styles.css" rel="stylesheet" type="text/css">
  <script src="js/scripts.js"></script>
</head>
<body>
  <h1>Calculator</h1>
  <form id="calculator">
    <label for="input1">1st number:</label>
    <input id="input1" type="text">
    <br />
    <label for="input2">2nd number:</label>
    <input id="input2" type="text">
    <br />

    <label>
      <input type="radio" name="operator" value="add">
      add
    </label>
    <label>
      <input type="radio" name="operator" value="subtract">
      subtract
    </label>
    <label>
      <input type="radio" name="operator" value="multiply">
      multiply
    </label>
    <label>
      <input type="radio" name="operator" value="divide">
      divide
    </label>

    <button type="submit" class="btn">Go!</button>
  </form>

  <h2>Results</h2>
  <p id="output"></p>
</body>
</html>
// Business Logic
function add(num1, num2) {
  return num1 + num2;
}

function subtract(num1, num2) {
  return num1 - num2;
}

function multiply(num1, num2) {
  return num1 * num2;
}

function divide(num1, num2) {
  return num1 / num2;
}

// User Interface Logic
function handleCalculation(event) {
  event.preventDefault();
  const number1 = parseInt(document.querySelector("input#input1").value);
  const number2 = parseInt(document.querySelector("input#input2").value);
  const operator = document.querySelector("input[name='operator']:checked").value;

  let result;
  if (operator === "add") {
    result = ad(number1, number2);
  } else if (operator === "subtract") {
    result = subtract(number1, number2);
  } else if (operator === "multiply") {
    result = multiply(number1, number2);
  } else if (operator === "divide") {
    result = divide(number1, number2);
  }

  document.getElementById("output").innerText = result;
}

window.addEventListener("load", function() {
  const form = document.getElementById("calculator");
  form.addEventListener("submit", handleCalculation);
});
Finding the Error
The issue that we've introduced into our scripts will cause JavaScript to report an error. If we open our Calculator website (or refresh the page), enter in two numbers, select the "add" option, and then submit our form, we'll immediately see a console error Uncaught ReferenceError: ad is not defined:

As we know, console errors can already give us a great deal of information! Based on the context, we know the error has something to do with the addition operation. We can see that the error message has to do with a variable that doesn't exist, and that we can see that the error is coming from line 27 of scripts.js. With this information alone, we can solve this error. However, DevTools can make debugging this error an even easier process.
The DevTools' Sources Tab
Let's open the Sources tab of our DevTools console. If your DevTools window is small, you may have to select the arrow icon >> to get a menu of other tabs options.
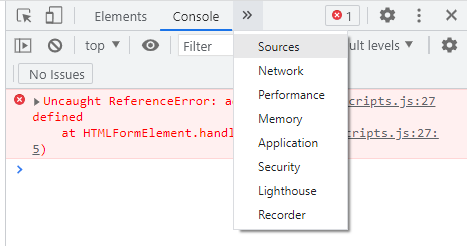
Note: We show content with the DevTools pane at the bottom of the browser window or on the right side. You can pick whatever orientation you prefer. You can change the orientation by clicking on the three vertical dots in the upper right corner and clicking the Dock side icon of your choice as shown in the image below:
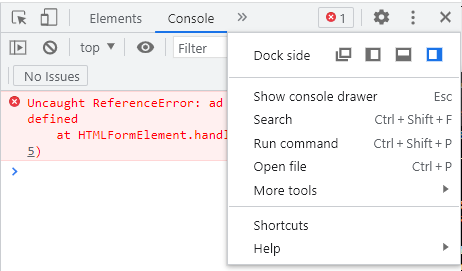
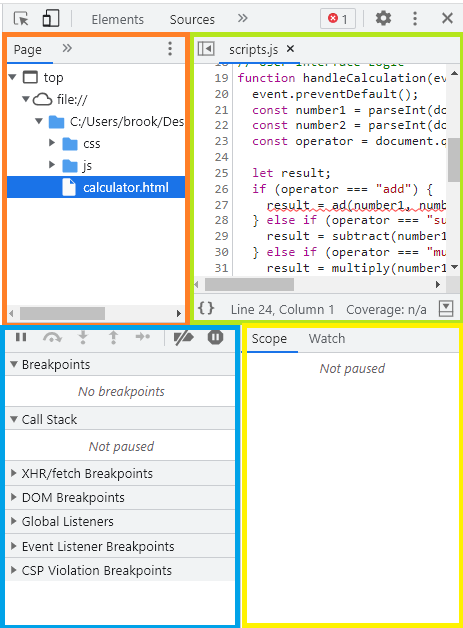
The Sources tab is used to view and edit the files in our project, and to debug JavaScript. There are other things that the Sources tab lets you do that we won't cover in the program. The image below highlights the different tools of the Sources tab in different colored boxes.
- The orange box on the top left is where we can view our project's files among other things. We can click on the different files to open them up in the window to the right.
- The lime green box on the top right is where we can see the contents of the files in our project. We can also set breakpoints in this window, which we'll learn about in the next lesson. Currently, the line that is throwing the error is underlined in a red squiggly line.
- The blue box on the bottom left has most of our debugging controls and options, and it also displays information relevant to our debugging process.
- The yellow box on the bottom right also has information relevant to our debugging process. Depending on how your DevTools window is oriented and how big it is, this area may be combined with the area highlighted by the blue box.
If you have an additional window within the Sources tab that shows a console or a "what's new" section, you can simply exit out of that.
Pausing on Exceptions
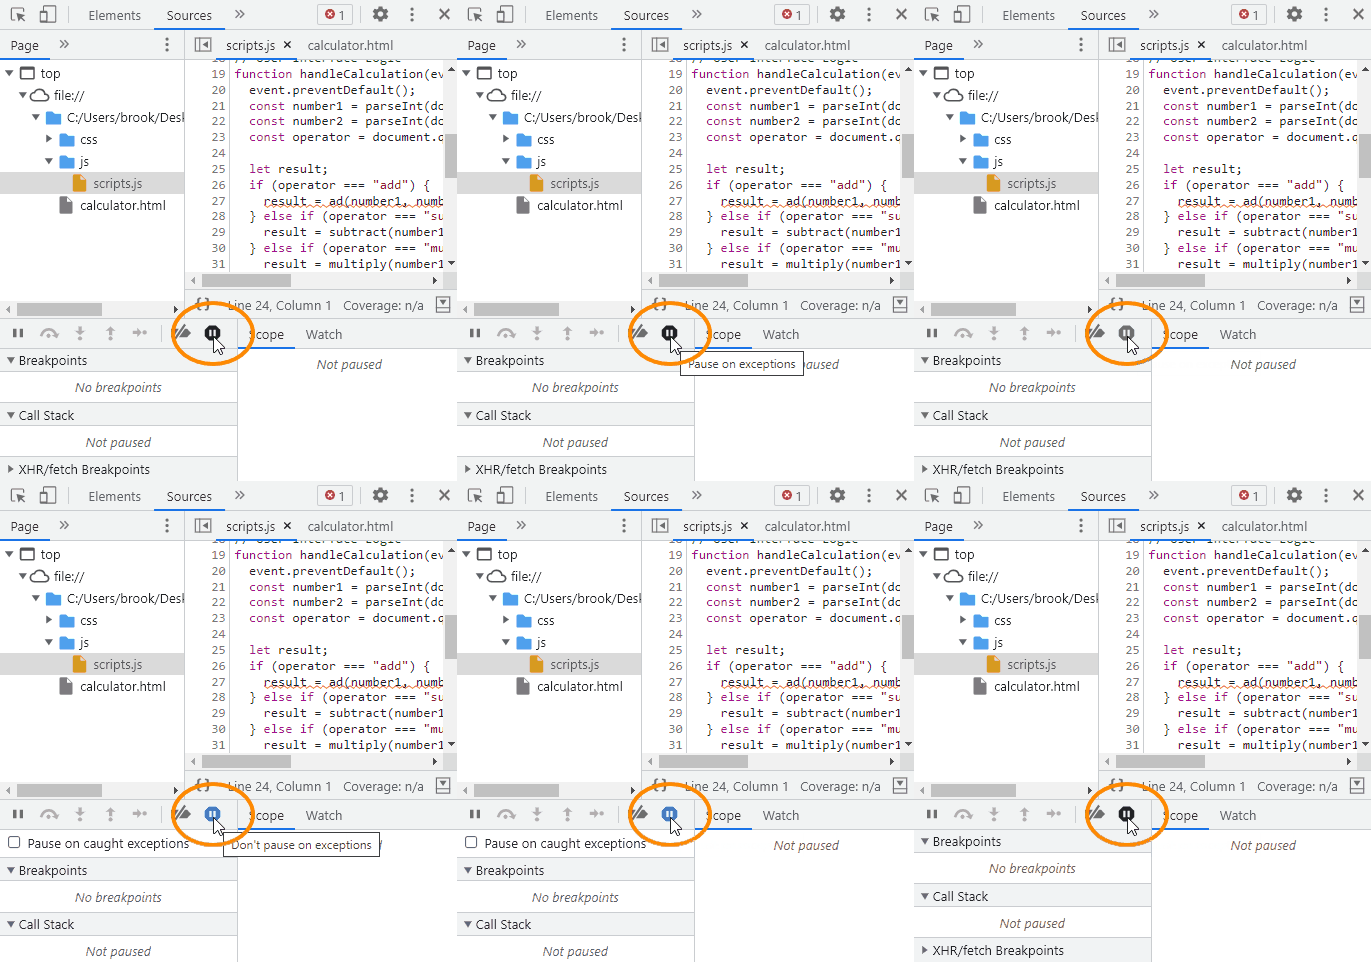
Now, let's configure our debugging tools to pause on exceptions. Click the button that looks like an octagon with a pause button. If we click the octagon, it turns blue and that means that we've configured our DevTools to pause on exceptions. The GIF below shows exactly where this button is. Depending on the location and size of your DevTools, this button may be located somewhere else.
When you turn on the debugging option to pause on exceptions, a checkbox that reads "Pause on caught exceptions" will show up just below the octagon. Checking this checkbox will configure the DevTools debugger to pause on errors that we already have code in place to handle. Just like the error handling for a user's age and height in the Amusement Park website. We won't be using this option in the program, so do not select it!
With the DevTools Sources tab open and the "pause on exceptions" debugging tool turned on, let's go ahead and resubmit our form with the "add" operation selected and the numbers 2 and 3 (or any other). This time, the uncaught ReferenceError will cause our DevTools debugger to fire, and we'll see a host of new information in the Sources tab. Let's review each new change that we see.
First, in the two windows at the bottom of the Source tabs, we'll see new information about the "Call Stack", the "Scope", and more.
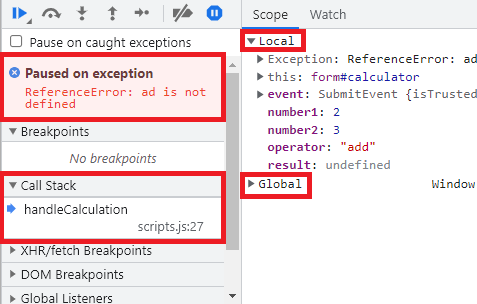
There are a couple things to notice:
- In the left-hand window, the error message is listed, along with the title "Paused on exception". This simply lets us know that we're dealing with an exception, and what the error message is, if any.
- Below that, we'll see a section titled "Call Stack" that gives us the exact location of the error, which is in the
handleCalculationfunction at line 27 ofscripts.js:27. A call stack is what a program uses to keep track of function calls. In this case, it's enabling our debugger to tell us exactly where the error occurred. - In the right-hand window, the "Scope" tab will tell us about all of the variables that are in local and global scope at the location in which the error occurred, which is the
handleCalculationfunction. (This information may be cutoff if the window is too small.) Right now, the "local" scope details information about:- The exception, and its type.
this, which represents the form element that the submit event listener is being called on.thisis a tricky subject that we'll revisit later in the program, so don't worry about understanding it now.- The event type and other related information.
- The variables and values for
number1,number2,operation, andresult.
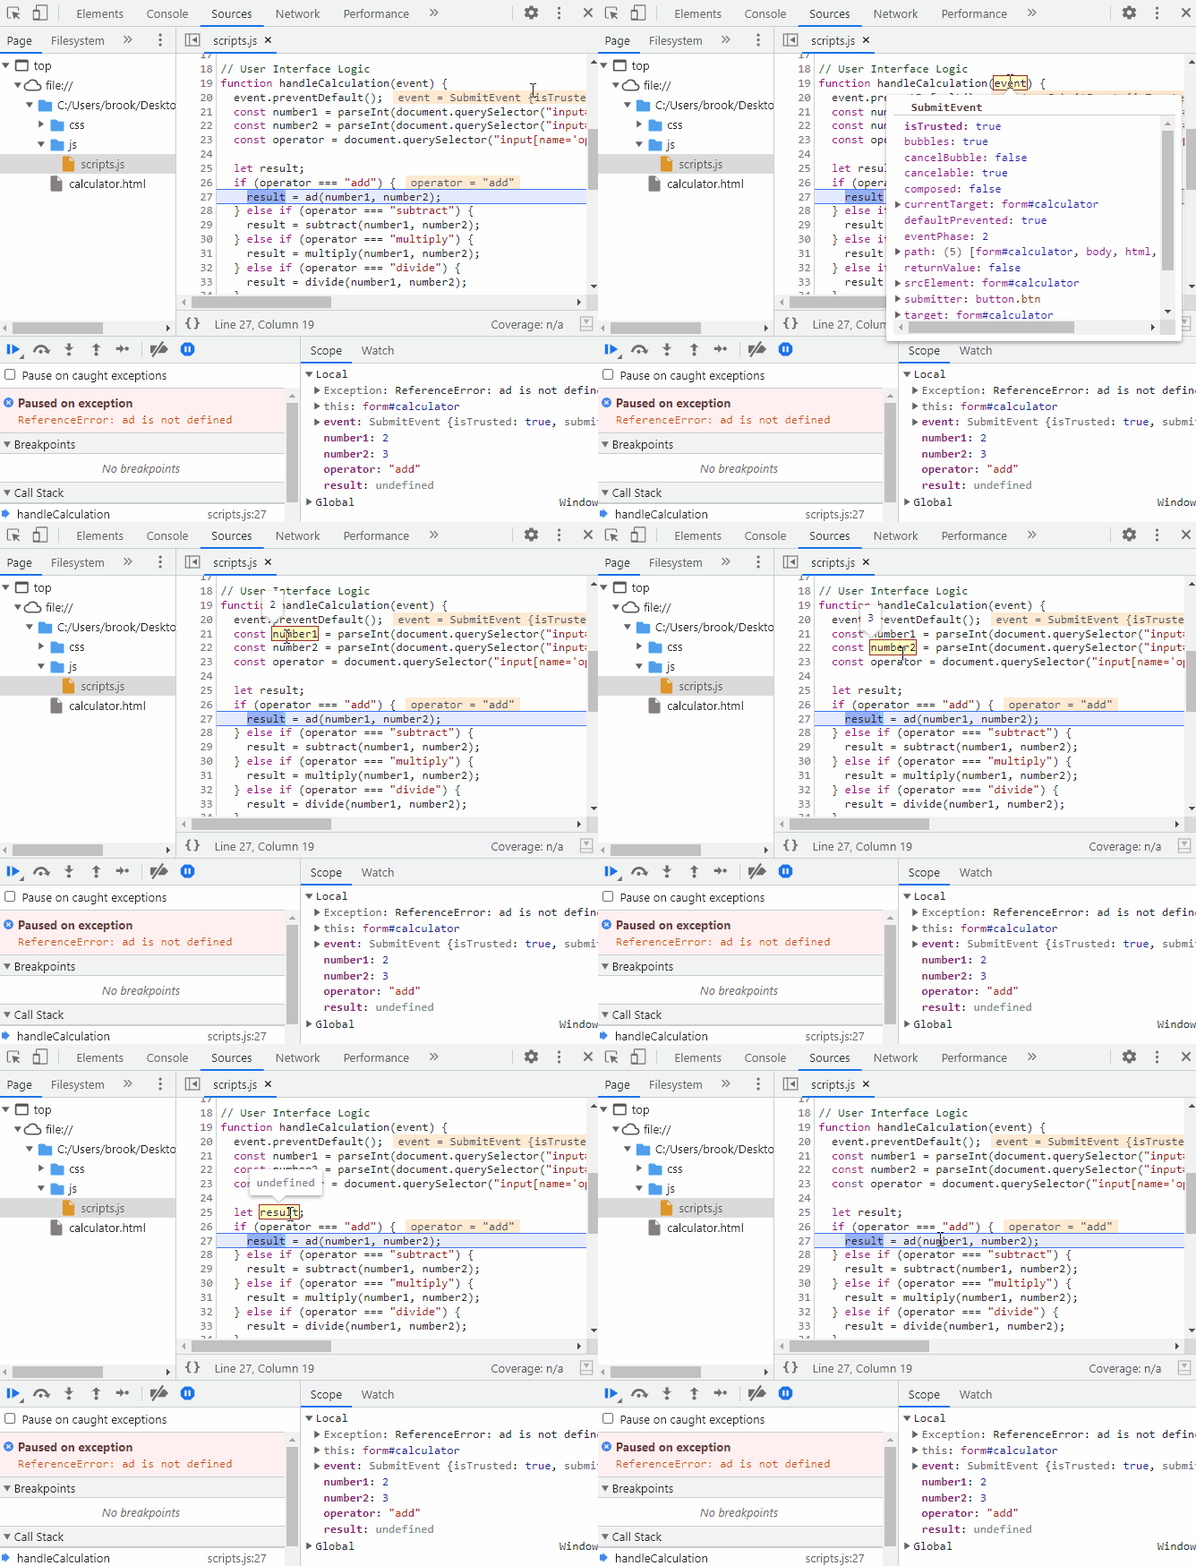
The other handy thing about using the pause on exceptions DevTools debugging feature is that it brings up the source code for our scripts and highlights the exact line of code in the exact file that's causing the error in the browser. Instead of reading the console error and returning to our VS Code to review our scripts.js, we can instead view our scripts in the Sources tab. This gives us extra context about the error we're dealing with and makes it way easier to debug.
The DevTools debugger also marks up the scripts.js file with the same information about the variables in scope (that are listed in the "Scope" area of the Sources tab) when the exception occurs. Watch the gif below that demonstrates this, and notice how some information is listed and highlighted in a different color, like operator = "add", and other variables' values can be shown by hovering over the variable names. For viewing purposes, we've made the scripts.js file large enough to easily see all of the contents.
Resolving the Error
So, how does pausing on exceptions help us find errors in our code? It automatically contextualizes the error in our code and it provides us with precise information about the values of local variables. By reviewing the information we're provided with, we should be able to combine the error message with the location of the error and determine that we've misspelled our add() function call, incorrectly calling ad().
In such a simple website, it may seem like overkill to use DevTools' debugging feature to pause on exceptions. We likely could resolve the error just by reading the console error and reviewing our source code in VS Code to spot the typo. Regardless of that, it's important to become familiar and comfortable with DevTools' more sophisticated debugging tools, because they will be able to do much more heavy lifting when debugging more complex and lengthy code.
So, when you go to test out a website, do it with the pause on exceptions feature turned on!
Exiting the Debugger
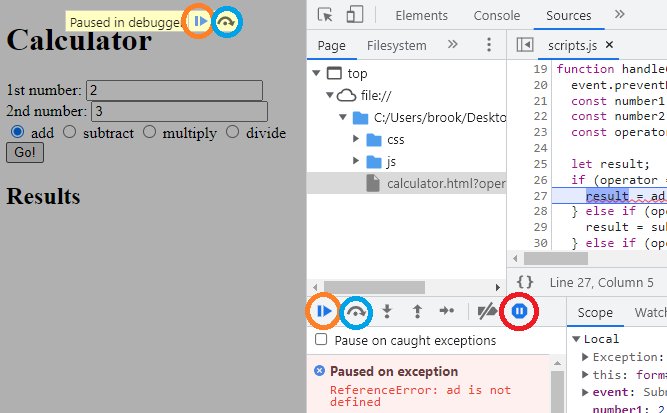
Now that we've figured out the issue in our code, we're ready to move on to the next thing, which means we no longer want to be paused in debugger. We have a few options to resume the normal execution of our scripts, which are highlighted in the image below:
- Select the play symbol (in the orange circle) to resume the execution of the scripts. This just means we don't want to be paused on the error anymore. If we haven't yet fixed the bug in our code, our website will still stop running once it hits the error.
- Select the right-pointing arrow that's rounded over a dot (in the blue circle) to call the next function. Just like with the play symbol, if we haven't fixed our code yet, our website will still be stopped at the error. So in this case, since the error has stopped our scripts, there's effectively no other function to call. This means that selecting this icon will do the same thing as selecting the play symbol to resume the scripts. In the next lesson, we'll see a more useful application of this button to call the next operation.
- If you want to turn off the pause on exceptions feature of the DevTools' debugger, then make sure to click the octagon icon (in the red circle). Even if you refresh your page, the pause on exceptions feature will stay on until you deselect it in the Sources tab.
