📓 1.2.0.4 Accessing and Configuring the Browser DevTools Console
In this section we'll use our browser's DevTools (developer tools) to practice new JavaScript concepts and tools, and to debug our JavaScript code. In the last course section, we learned how to use the Elements tab to explore our HTML and CSS. In this section, we'll explore the Console and Sources tabs. Our goal is to become very comfortable with using browser DevTools so that we can improve our development and debugging processes.
In this lesson, we'll cover how to access and configure the DevTools console. In the next lesson, we'll cover how to use the DevTools console in personal practice and in pair programming.
Take note that all of our instructions are for the Google Chrome browser DevTools. While major web browsers offer very similar options and configurations for their developer tools, there may be slight differences that could be confusing. If you are not using the Google Chrome browser yet, we recommend downloading and installing it now.
Accessing DevTools
To access your browser's DevTools, start by finding the browser menu, an icon with 3 dots or lines in the top right-hand corner of your browser. If you are anything like me, it could say "update" next to the three dots/slashes, indicating that you have an update to install for your browser.
Once the menu is open:
- Go to the More Tools menu.
- Then, select Developer Tools.
Shortcuts for accessing the DevTools console are:
- Windows:
Ctrl+Shift+jCtrl+Shift+i
- Mac:
Cmd+Option+iF12
Shortcuts for accessing the DevTools Elements inspector are:
- Windows:
Ctrl+Shift+c - Mac:
Cmd+Shift+c
DevTools Inspector Versus Console
The DevTools inspector and console are different. Each lives on a separate tab in the DevTools window. The DevTools inspector is found in the Elements tab and helps us inspect HTML elements. This includes being able to look at an element's CSS rules and adjust them. You can optionally review the features of the elements tab in this lesson from the previous section.
The DevTools console is a JavaScript console that lets us write and execute JavaScript code. It is found in the Console tab of the DevTools window. This console is also used for logging errors and warning messages. We'll learn how to use the console in this section. As a preview, see the image below with the DevTools console open and a line of JavaScript (3 + 4;) written.
Tips for Using the Console
Configuration
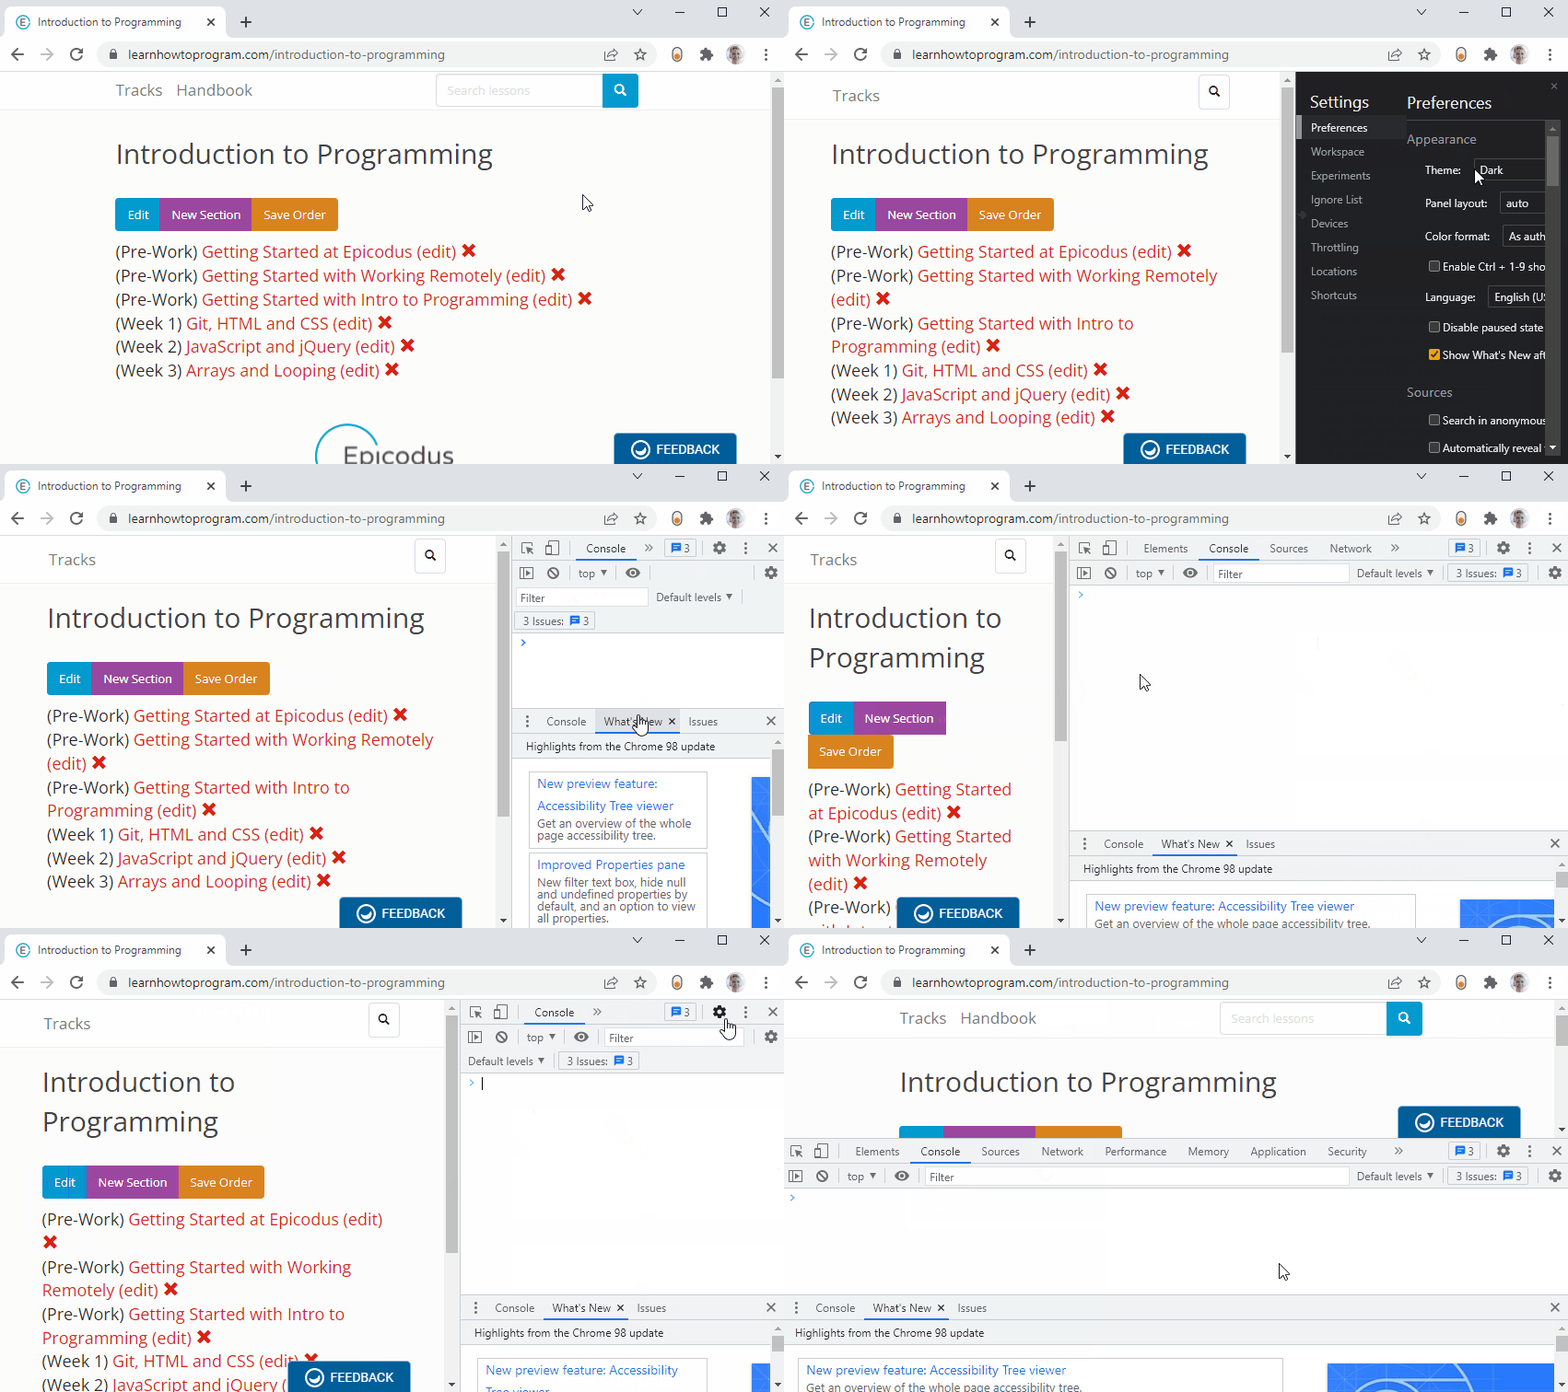
You can configure the console's location, size, and colors! Review the instructions below, and optionally check out the Gif that summarizes these configuration options.
To set a dark or light theme:
- Click the Settings cog at the top right corner of the DevTools window.
- Go to the Preferences tab (this is usually the default location that settings opens to).
- Under the Appearance section, look for Theme and set it to your preference. When you change a setting, the DevTools window will prompt you to reload.
To increase/decrease the size of the text:
- For Windows: use
ctrl+shift++to increase andctrl+shift+-to decrease text size. - For Mac: use
cmd+shift++to increase andcmd+shift+-to decrease text size.
To increase/decrease the size of the DevTools window:
- Simply drag the side of the window in/out or up/down. The DevTools window acts the same as a browser window.
To move the location of the DevTools window:
- Select the menu represented by three vertical dots in the top right corner of the window. This will be next to the settings cog. Once open, find the option for dock side and select the option that works best for you.

Formatting Code
When typing code into the console, we have some options to format what we write:
- To create a new line, use
shift+enter. - To tab over multiple spaces for indentation, use
tab. To configure the console to use 2 spaces for indentation withtab, in the DevTools window, go to Settings > Preferences > scroll to the Sources section > set "Default indentation" to 2 spaces.
Autocompletion
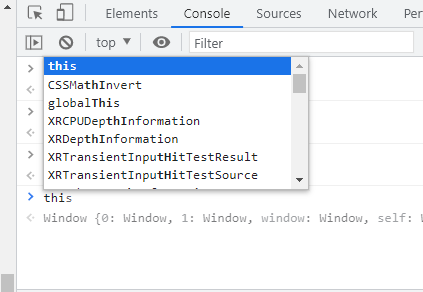
This can be very helpful, but when you are just starting out with the DevTools console, it can be more confusing than helpful. Check out the following image. In the image, I've only typed out thi in the console. I haven't even completed what I've wanted to type, which is this, a JavaScript concept we'll learn about later in the course. However, autocomplete has already suggested an s to complete the word this and a host of other suggestions, as well as a possible answer (Window {0: ...}). Like I said earlier, this can be confusing when you are just starting out.

We'll be working with the autocomplete feature later in this section. If autocomplete is bugging you as you work through the upcoming lessons, you can turn autocomplete off by going to Settings > Preferences > Sources and unchecking the box for "Autocompletion".
Or, you can work with autocompletion turned on. Here's how to do that:
- To accept an autocomplete suggestion, hit
enterortab - To navigate through the list of autocomplete suggestions, use your arrow keys or scroll with your mouse or trackpad.
- To ignore or deny an autocomplete suggestion, complete what you are typing and use a
spaceor punctuation, like;,{ }or( ). We'll learn more about punctuation in JavaScript soon.
Clearing the Console
You can clear the contents of the DevTools console by clicking the icon of a circle with a slash at the top toolbar of the console. See the following image, where the icon is circled in red:
DevTools Documentation
Optionally, you can review documentation on browser DevTools, but generally everything you'll need will be covered in the lessons. To see the Chrome DevTools documentation, go to this link.