📓 1.2.4.7 Debugging in JavaScript: Using debugger and Breakpoints
This is our fourth and final lesson on basic debugging with JavaScript. In this lesson, we'll use DevTools debugger to pinpoint and fix two new bugs in our Calculator JS.
Of the four debugging tools we're covering now, debugger is the most important tool to master. Pay close attention and make sure you understand the basics of using this tool. Don't worry — you will get plenty of practice with debugger. We recommend using this tool every time you are trying to solve an error in your code.
The debugger tool freezes execution of our code so that we can run our own experiments in the scope that the code is frozen in. Debugger is similar to pausing on exceptions in that we can see what variables evaluate to during mid-execution of a function. However, you don't need an exception to be thrown to use debugger to explore inside of a function. Debugger works really well with bugs that don't throw errors in our code, like undefined values.
There are two ways to freeze our code using debugger — a great way and a not-so-great way. We'll start exploring the great way first, and we'll continue to use the same Calculator project when we learned about pausing on exceptions.
Remember that it's optional to code along with this lesson. The next lesson is a practice prompt to build a new project and try using these debugging tools. If you are coding along with this lesson, make sure to use the JS below, and the HTML from the previous lesson.
Project Setup
Take note that we've introduced two new bugs!
// Business Logic
function add(num1, num2) {
  return num1 + num2;
}

function subtract(num1, num2) {
  return num1 - num2;
}

function multiply(num1, num2) {
  return num1 * num2;
}

function divide(num1, num2) {
  return num1 / num2;
}

// User Interface Logic
function handleCalculation(event) {
  event.preventDefault();
  const number1 = parseInt(document.querySelector("input#input1").value);
  const number2 = parseInt(document.querySelector("input#input2").value);
  const operator = document.querySelector("input[name='operator']:checked").vale;

  let result;
  if (operator === "add") {
    result = add(number1, number2);
  } else if (operator === "subtract") {
    result = subtract(number1, number2);
  } else if (operator === "multiply") {
    result = multiply(number1, number2);
  } else if (operator === "divide") {
    result = divide(number1, number2);
  }

  document.getElementById("output").inerText = result;
}

window.addEventListener("load", function() {
  const form = document.getElementById("calculator")
  form.addEventListener("submit", handleCalculation);
});
Using Breakpoints
With the Calculator project opened in the browser, let's submit our form. In our example, we've inputted the numbers 2 and 3, and selected to add them together. When we submit the form we get... well, nothing! No result and no error! In this situation pausing on exceptions won't help us.
Let's start our debugging process by opening our DevTools and navigating to the Sources tab.
On the left of the Sources tab, we'll see our project's file tree. Open up the js/ directory and click on scripts.js to open it in the window to the right. We can open up any file from our project in this way.
Check the GIF below, which walks through the whole process — including adding breakpoints, which we'll discuss further in a moment.
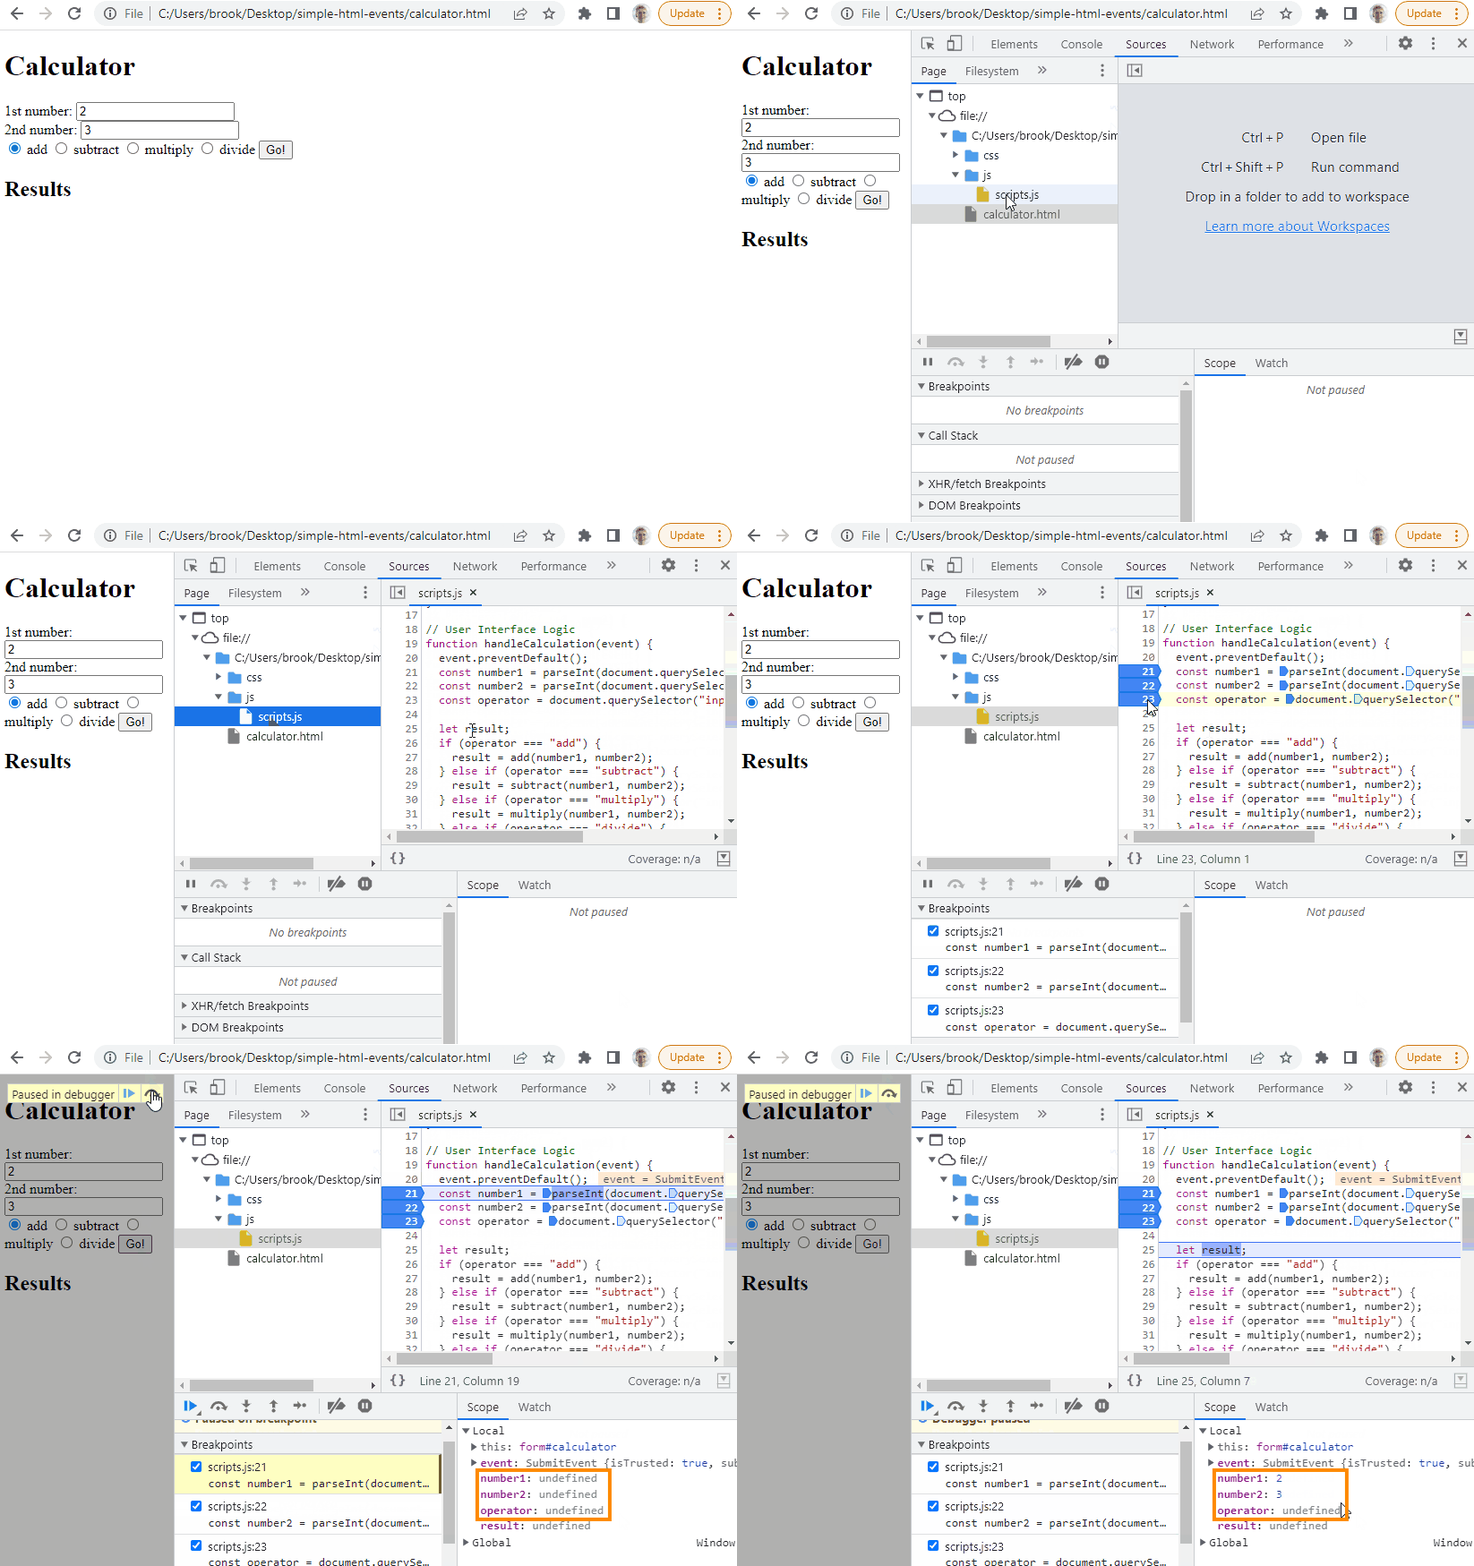
In the GIF above, several things happen. After opening the Sources tab, we first ensure that we are looking at the correct file by selecting scripts.js in the left-hand window (the Page tab within the Sources tab). When we start creating projects with more JS files, it's especially useful to be able to switch between them in this window.
Next, we click on three lines in our code to create a blue arrow next to each line. This is a breakpoint, which means that our code will pause execution when it hits the line of code to the right of the blue arrow. In this case, our first debugging step is to make sure that we're properly getting the form values, so we're adding breakpoints next to lines 21, 22, and 23 to verify that we're correctly getting the values for the variables number1, number2, and operator.
Then, we submit the form. Because we've added breakpoints, the familiar "Paused in Debugger" message and menu pops up. In the gif we use the right-pointing arrow that's rounded over a dot (in the blue circle in the gif) to call the next function. This moves us through each breakpoint and each line of code. As we click this arrow, we can see our code running, one line at a time. The orange box highlights how the debugger tracks the value of each variable every time we click the arrow and run the next line of code.
Notice that after we run line 23, the variable operator is still undefined! That's likely where the first issue is. If we double check line 23, we should be able to spot another typo in the value property, incorrectly written as vale. This is our first bug!
We can use the scripts.js in the Sources tab to verify this. Check out the gif below that demonstrates this.

When we first hover over document.querySelector("input[name='operator']:checked").vale; the DevTools debugger tells us that undefined is returned (highlighted by the green square).
Then, when we update vale to value and hover over document.querySelector("input[name='operator']:checked").value; again, the debugger tells us that "add" is returned (highlighted by the orange square).
Note that while the JavaScript files in the Sources pane contain references to our source code, any changes we make in the Sources pane won't actually change our code in VS Code. This is a good thing because we have a sandboxed environment where we can experiment with code in the browser without needing to worry about the integrity of our actual source code.
Tips for Using Breakpoints
We've solved our first bug, and we have one more to go. Before we move onto the next bug, let's review some tips for using breakpoints.
First, it's important to note that refreshing your page or exiting from the DevTools won't remove your breakpoints. Instead, you need to remove them by clicking on them to toggle them off.
Also, the breakpoint should always be added to the line right after the line we actually want to evaluate. This is because we want to evaluate a line after it has run, not before — and the breakpoint will stop the code as soon as a line is reached (and before the code from that line is evaluated).
With this in mind, an easier way to evaluate the values of number1, number2, and operator would be to set a breakpoint for the line afterwards. Check out the gif below that demonstrates this.
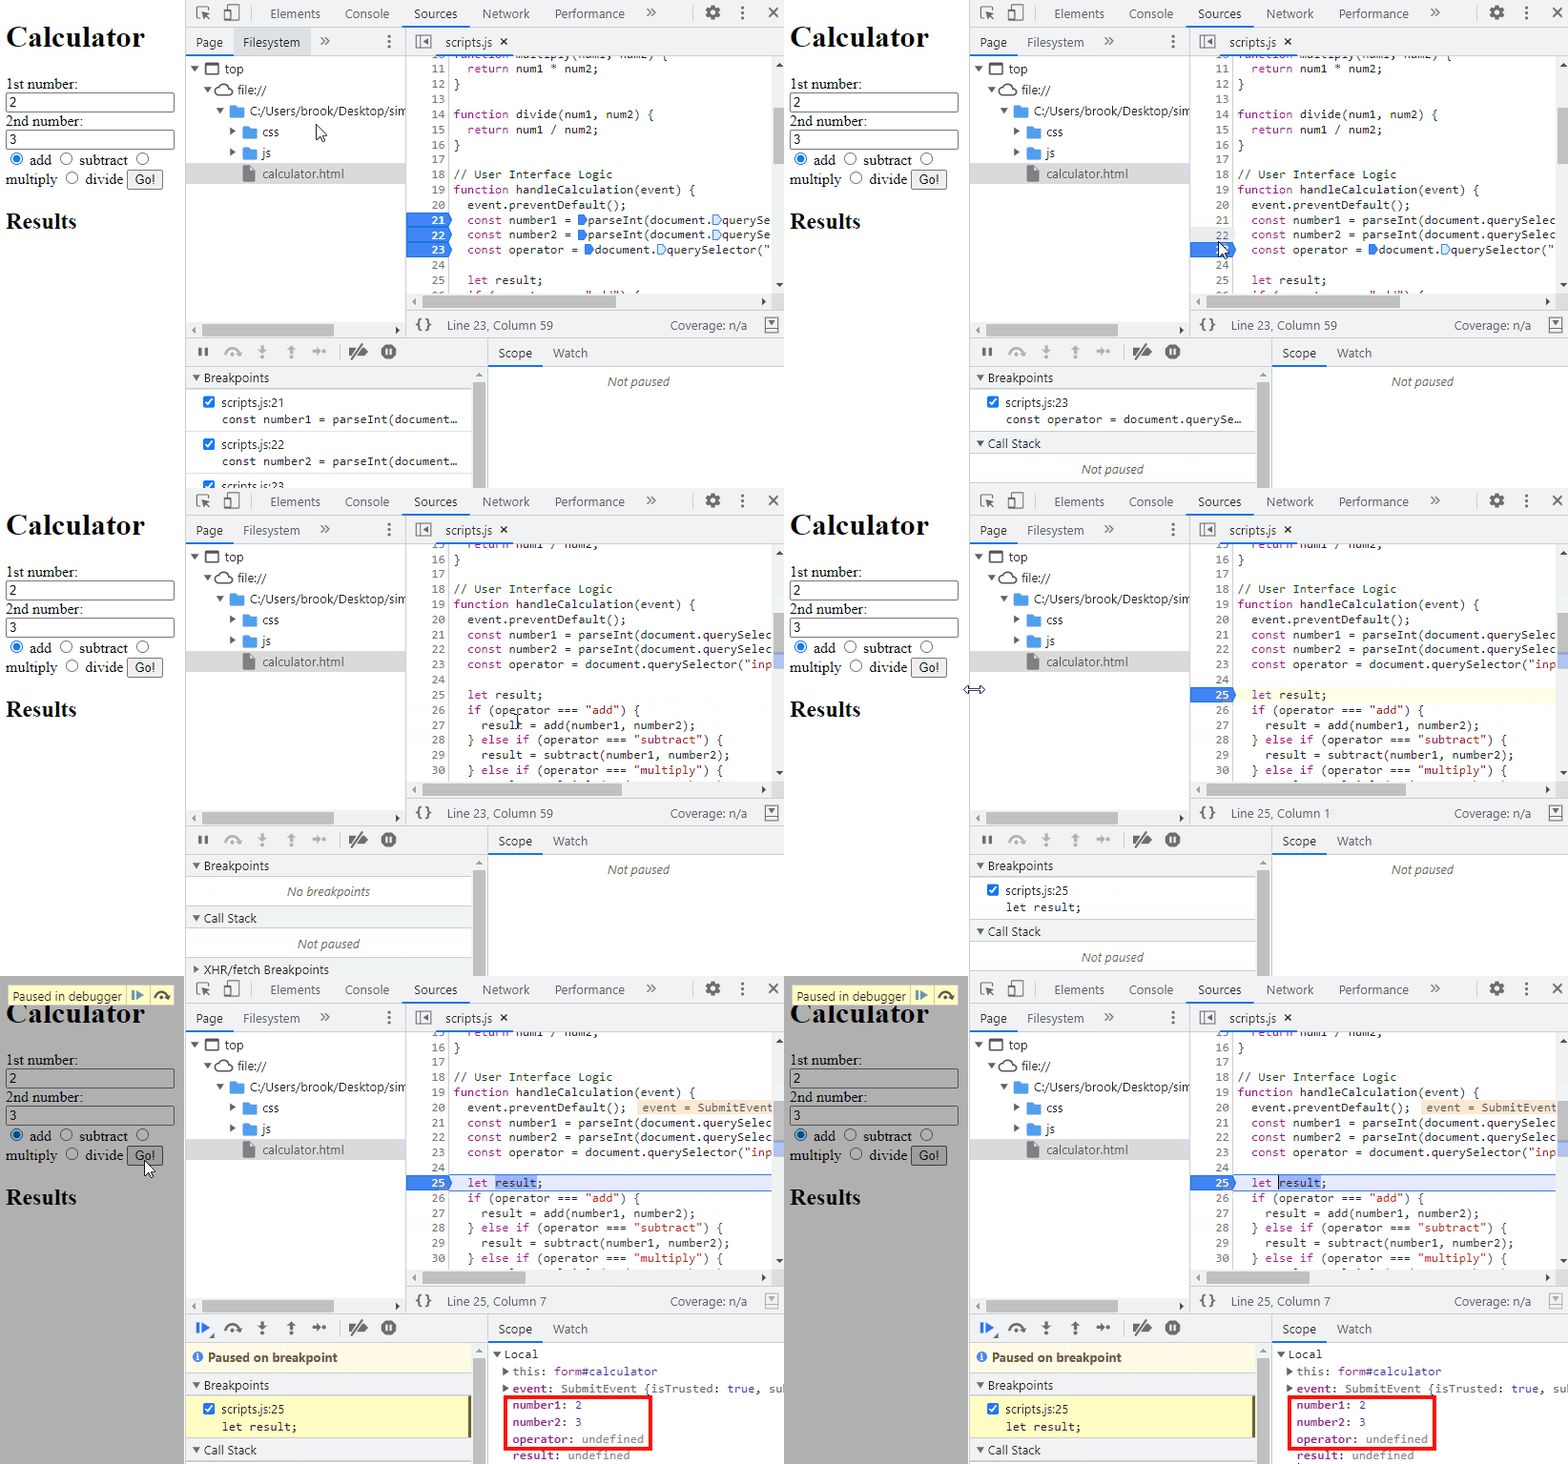
As we can see in the gif, adding one breakpoint to line 25 (with let result;) lets us immediately see the values of all of the variables number1, number2, and operator (highlighted by the red square) right after we submit the form.
The last tip is that if there are multiple function calls on one line of code, we can optionally set a breakpoint for the additional function(s). Check out the gif below that demonstrates this.

This just gives you a finer grained control. There likely won't be a lot need for that extra fine grained control in the applications you build at Epicodus, but that depends how you are writing your code (for example, if you are chaining multiple method calls) and where the bug is that you are trying to locate!
Solving the Second Bug
We're ready to move onto the second bug. If you are coding along with this lesson and you haven't already fixed the first bug, do so now.
Let's resubmit the form and see what's going on now. Well, turns out we're still experiencing the same behavior — nothing in the results and no error message. What could be going on?
Let's continue with the breakpoint on let result; on line 25 and see what happens as we step through each line of code. Watch the GIF below that demonstrates what happens, and pay attention to the values of the variables in scope as we step through each line of code.
Note that in the GIF below, we don't see the usual grayed out webpage and "Paused in debugger" message, even though we are in fact paused in debugger and have a breakpoint on line 25. This just seems to be an occasional glitch with DevTools. If this happens to you in your own debugging process and it's throwing you off, the best thing to do is to refresh the page and submit the form again.
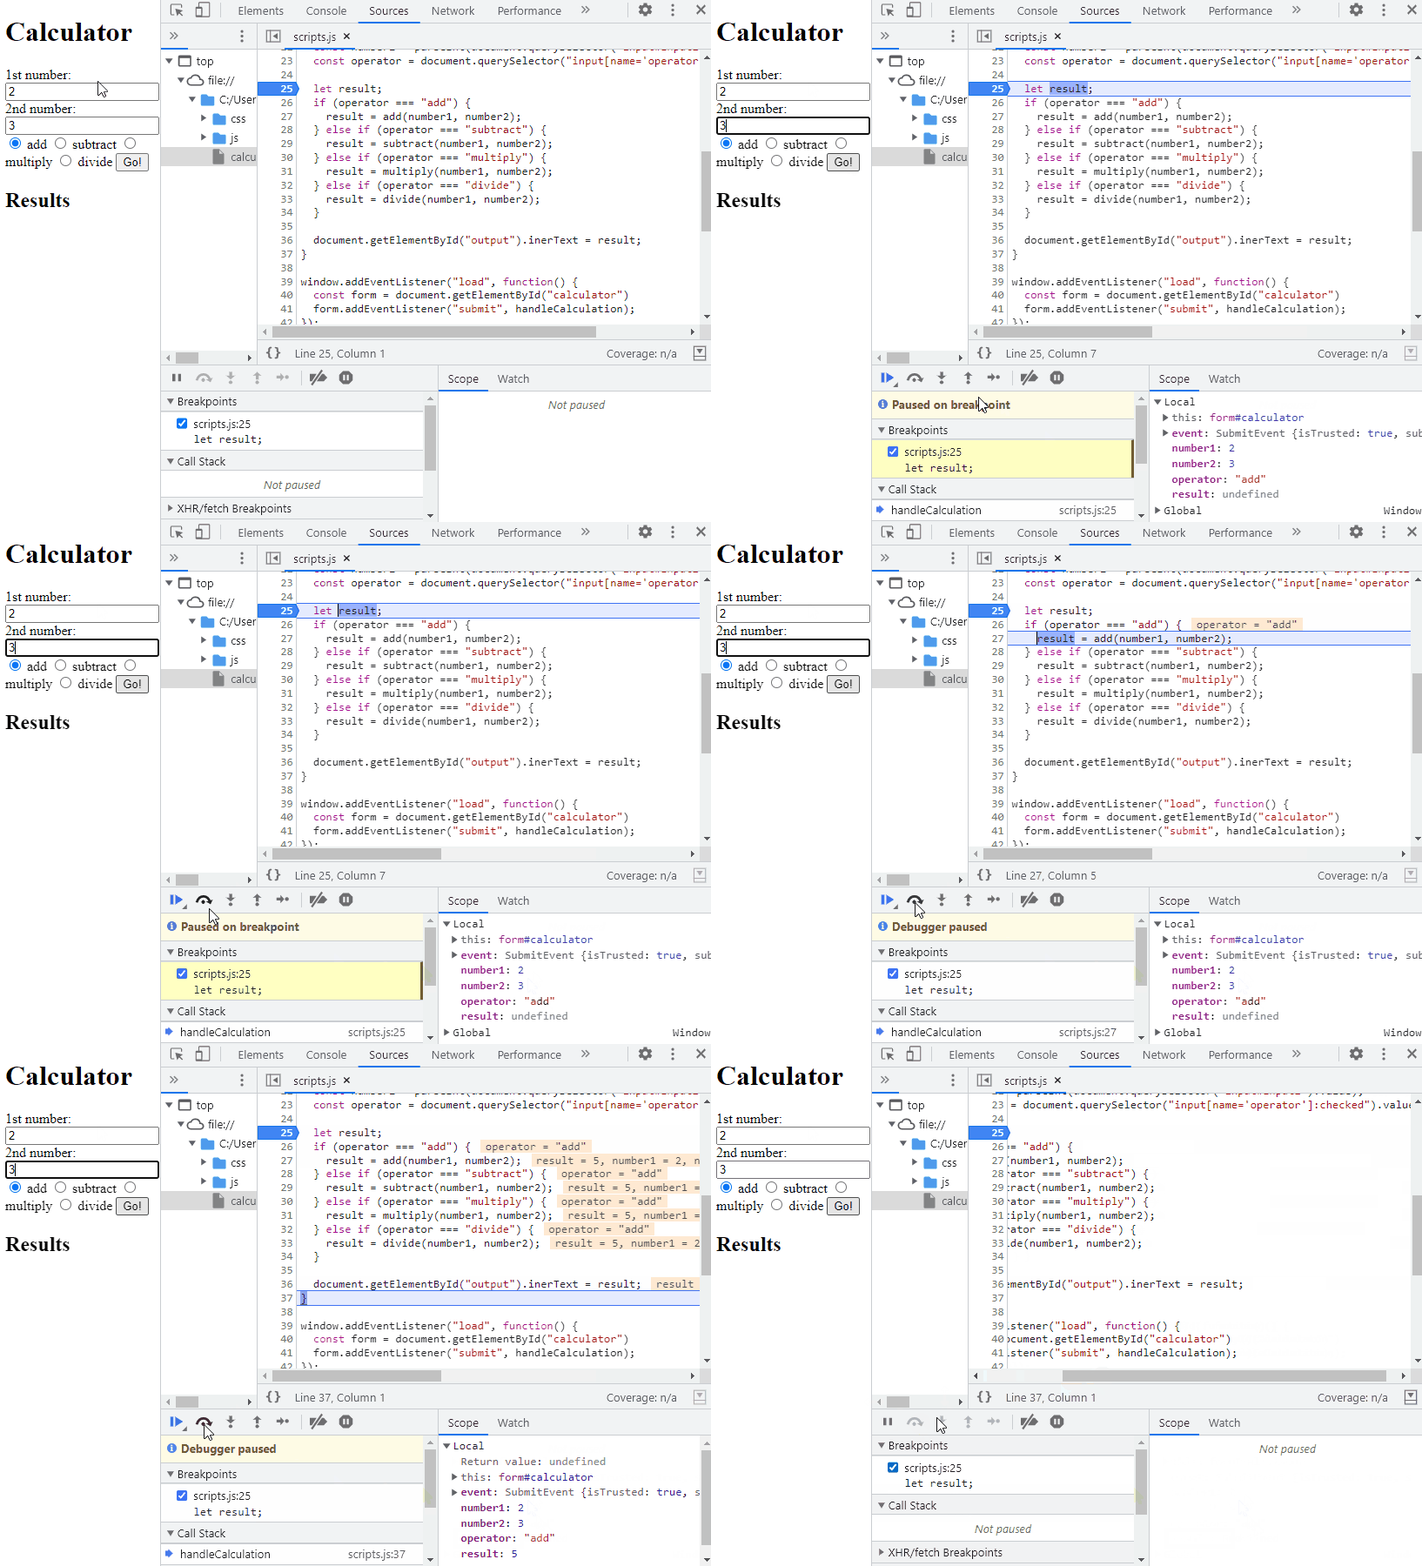
When we first hit the breakpoint on line 25 let result;, we can see that the three variables number1, number2, and operator are all defined. result is not defined, because we haven't worked our way through the if/else branching statements.
Then, we move through our scripts one line at a time. In total, we click the button to "step over the next function call" five times:
- With the first click, we are taken to line 26
if (operator === "add") {, which evaluates to true. This means that on the second click to step through our code, we're taken immediately to line 27result = add(number1, number2);. Until we step through our code again, we won't know if that code works. - With the third click, we're taken all the way down to line 36
document.getElementById("output").inerText = result;. Line 36 hasn't executed yet, but we can see thatresultnow has a value of5, and the rest of the if/else branching statements were skipped. - With the fourth and fifth clicks we move to line 37 and 38, completing the execution of all of our scripts. Since we're at the end of our scripts, this kicks us out of the debugger completely! You can tell when you are no longer paused in the debugger, because all of the markup in the
scripts.jsfile (in the Sources tab) disappears, and so does the gray wash and debugger menu options on the webpage itself.
Since all of our variables are defined and our if/else statement is working correctly, that points to an issue on line 36. A quick review of the line should reveal the bug in our code, but, let's try something else: taking this line of code and exploring it in the DevTools console. That's right, when actively in the debugger using breakpoints, we can call on and explore the variables in our scripts directly in the DevTools console.
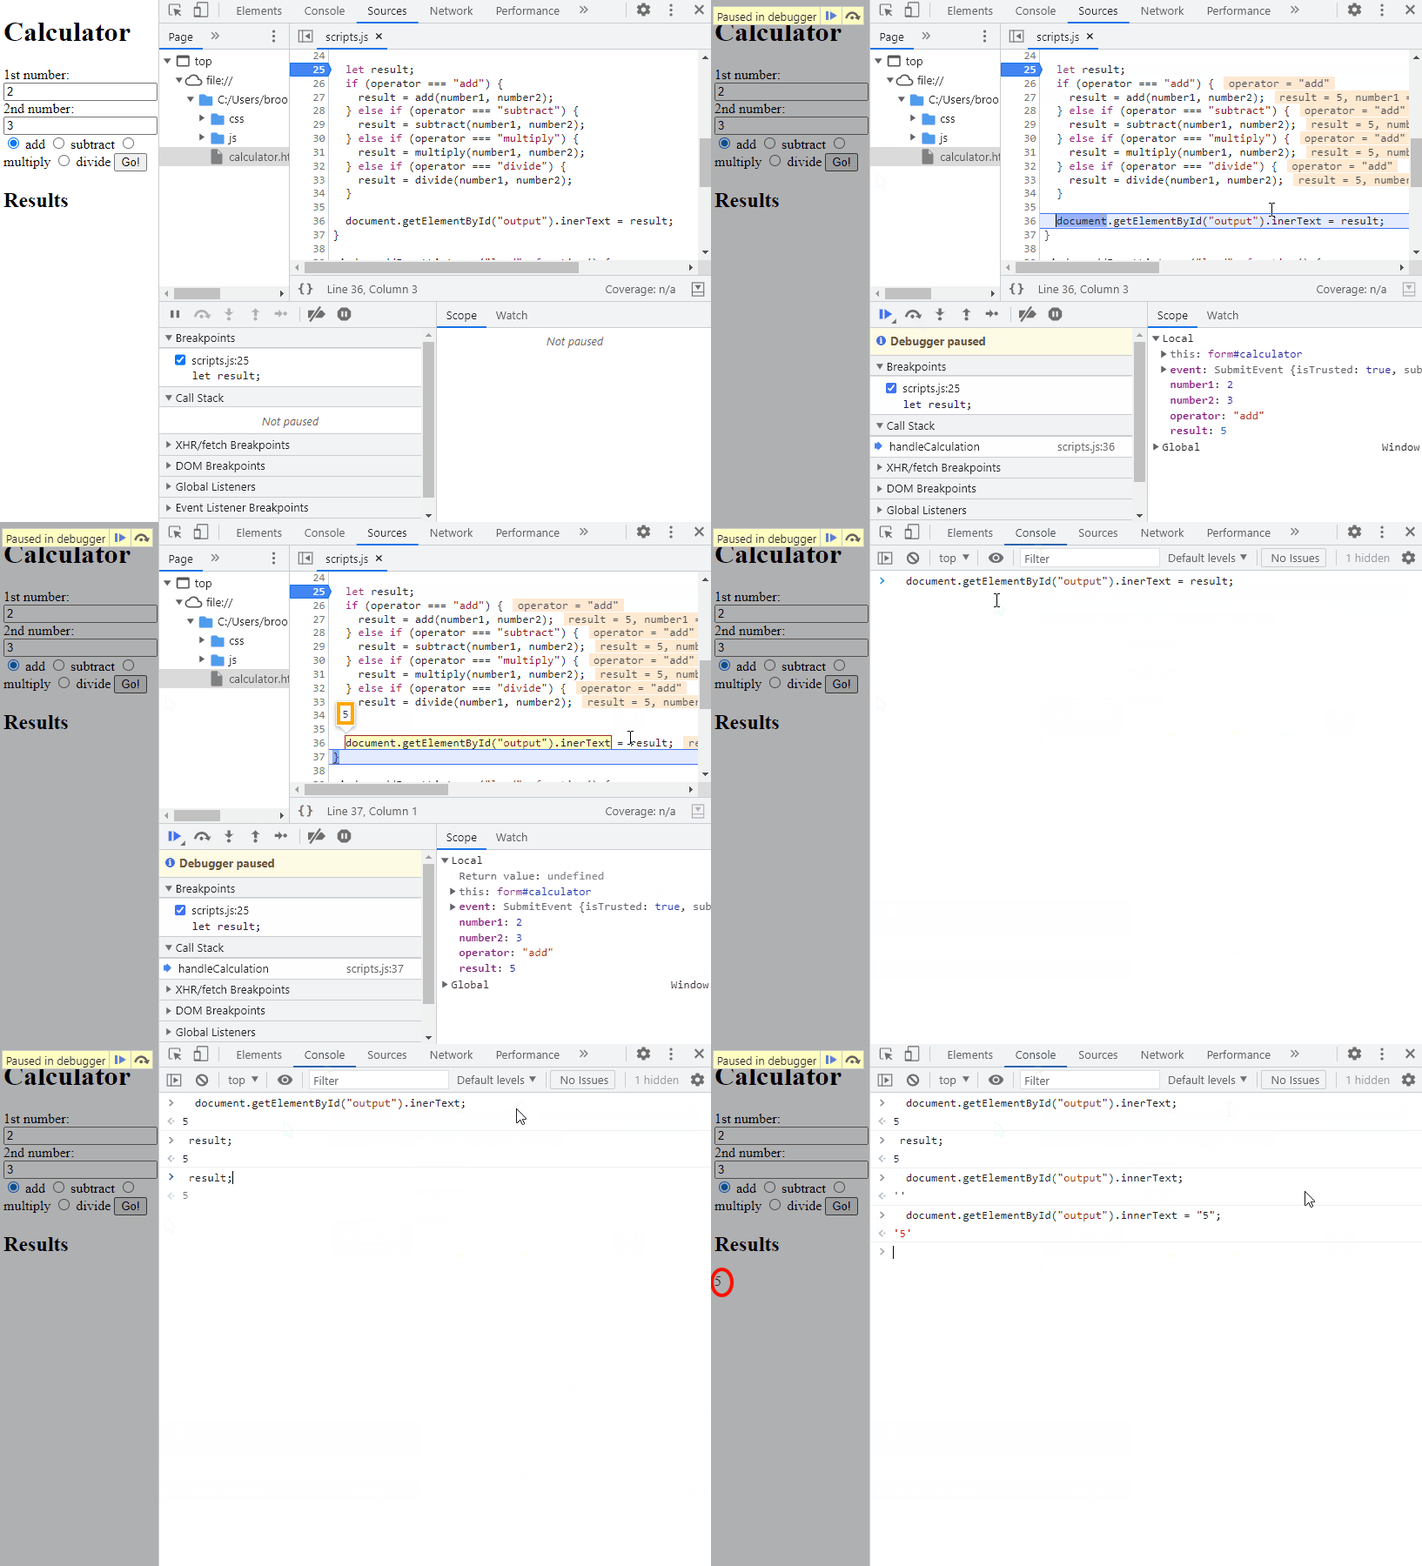
As we can see from the gif, this bug is one of those tricky ones. A simple typo in the property name inerText makes JavaScript think that you are creating a brand new property, instead of mistakenly trying to access the innerText property of the HTML element. We can see in the debugger that JavaScript properly sets the value of the incorrect inerText property to 5. We found that out by hovering over the variables and lines of code in scripts.js in the Sources tab.
Then, we copied line 36 and pasted it directly in our DevTools console. Here, we can explore the variable values, and try out different solutions to solve our bug. This is a very powerful feature of debugger: we can experiment with the value of variables and run any code we want within any local scope in our application — as long as our breakpoint is paused within that scope.
At the very end of the gif, we see that we are able to correct the typo and correctly display the result in our webpage! Now, we can take that fix and update our codebase accordingly in VS Code.
Using debugger;
The not-so-great way to use DevTools' debugger is to drop a debugger; statement directly in our code where we want the code to stop. Not the code in the Source tab, but our code in VS Code! The image below shows a debugger; statement added to line 26 of our scripts.
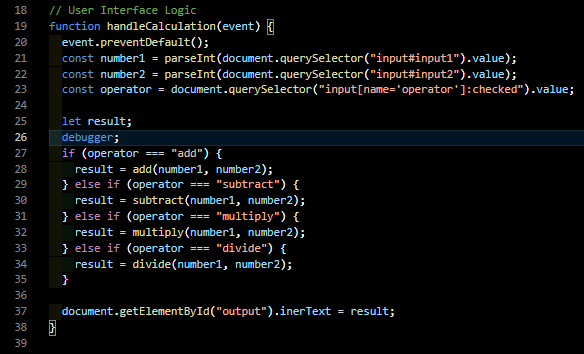
When we refresh our website, open DevTools to the Sources tab, and submit our form again, our DevTools will stop the execution of our code right when it hits the debugger; statement and we'll be paused in debugger. Everything that we can do with breakpoints, we can also do via the debugger; statement.
However, using debugger; is a less convenient approach, because we'll need to manually add and remove the statement from our website's codebase. While we also manually add and remove breakpoints in the Sources tab, these are not permanently in our codebase. If you forget to remove a debugger; statement from your codebase, it will freeze execution of your code whenever anyone uses it. As you can imagine, that would be a disaster for a production codebase. This is why you absolutely can't forget to remove the debugger; statement when you are done with it!
Summary
We've now fixed all of the bugs in our code. Woohoo! If you've been coding along with this lesson, make sure to actually make the updates in VS Code. Make sure to remove any console.log() or debugger; statements that may be in your code as well. At this point, it should be clear how helpful breakpoints are for pausing our code mid-execution so that we can explore and debug.
Using breakpoints is hands down the most powerful of the debugging tools we've covered during this course section. However, all of the debugging tools are useful in their own way, and it's important that you get familiar with each of them. If you are a good debugger, you are well on your way to being a good coder.