📓 2.3.0.10 The DevTools Network Tab
In this lesson, we'll take a look at the Network tab and how we can use it to debug API calls. As it usually goes for each tab in our browser DevTools, there's a lot of available tools, so we'll just stick to the basics.
Postman and the DevTools Network tab can offer similar information, and it's likely that Postman will meet most of your needs. We recommend that you use Postman before you start coding to test out your API and get to know how its response is structured. You should also use Postman to try out different parameters while you are coding or expanding your code's functionality.
On the other hand the Network tab can be helpful when your API call is failing in the browser, but not in Postman. This happens on occasion. What's notable here is that the Network tab offers debugging tools for API calls in the context of making them from the browser, which Postman cannot offer. So, let's get familiar with this new tool by learning the very basics.
DevTools Network Tab
The Network tab in our browser's DevTools logs all requests made on the network. This includes requests to our localhost and to outside resources, like third-party APIs. For demonstration, we'll continue to use our OpenWeather API project.
With our project opened in our browser, when we first open the DevTools to the Network tab, we probably won't see anything in it. However, if you refresh the page, we'll see all of the requests made to localhost to populate the webpage. The requests made when we first load our webpage are highlighted by the red rectangle below.
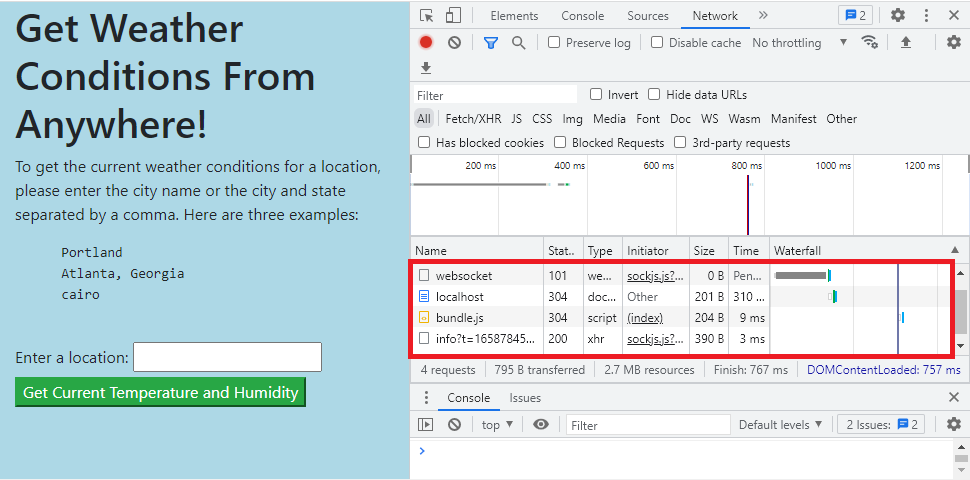
Generally, we won't need any of the data from those requests. Though if we were working on performance optimization, we'd use that data. What we're interested in is any information about our API call to the OpenWeather API. Let's see what happens when we submit the form to get weather data for Portland.
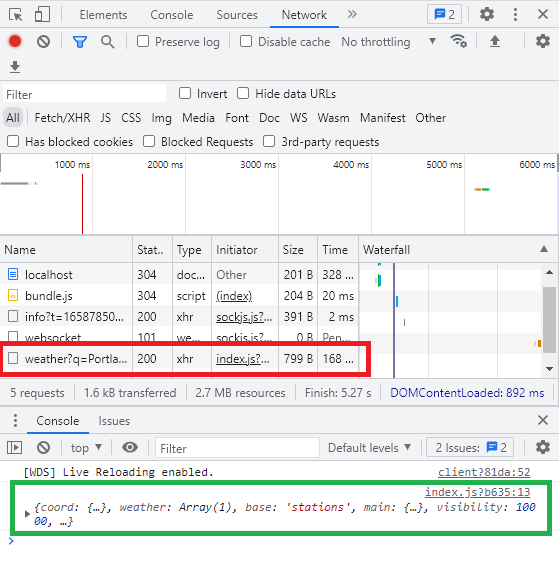
As highlighted in red in the image below, we'll see a new request listed. We can hover over the data in each row to get the following information:
- The full URL of the request.
- The status code of the request, which is 200.
- The type of request, which is listed at "xhr", which is short for
XMLHttpRequest. - The "initiator", or where the request originated from in our code.
- The size of the transferred data and how long the request took to complete.
- Where the request is located within the "waterfall" of all requests. In otherwise, the "waterfall" is a visualization of which requests occurred when and for how long.
Also, the API response object is conveniently added to the small console at the bottom of the DevTools, which we can expand and explore. This is highlighted in green in the following image.
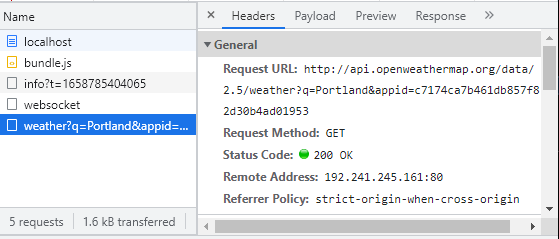
When we click on the name of a request, a new window will open to the right of it with even more data about this request. There's many tabs in this new window, and we're opened directly to the Headers tab. The headers of an API call include additional information about the request or response, including:
- What type of request is it? We'll be performing GET requests to get information, and later in the program we'll learn how to make POST requests to add new information to an API.
- What is the origin of the request? This means, where did it come from, which in our case is localhost.
- What is the language and what is the encoding? We won't need to configure this information in the program.
We won't spend a lot of time changing our headers, since we'll stick to basic configurations. To optionally explore more about headers, visit the MDN documentation on HTTP headers.
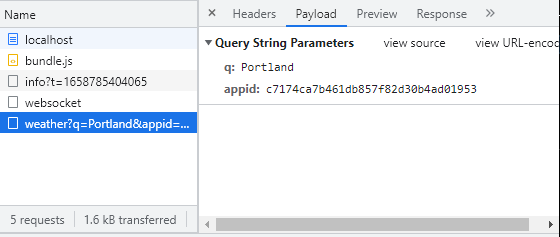
The next tab over is called Payload and this lists the parameters that are included in the request URL, as well as any data that we're sending along with the request. Not data about the request, but data like user input that we need to add to an API call to get the right data we're looking for.
The next two tabs, Preview and Response, both show the API's response in different formats. The Preview tab nicely formats the response in a way that makes the object easy to explore.
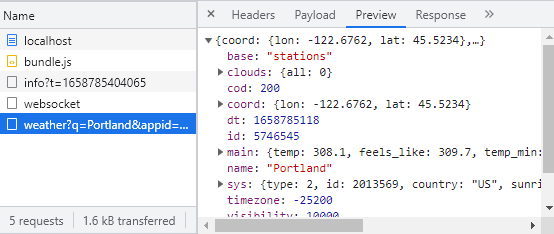
The last two tabs, Initiator and Timing, include information about where in our code the request came from (the getWeather function in index.js), and how long it took for our request to complete. We won't use these last two tabs much.
Throttling
The DevTools Network tab includes an option for throttling. When we throttle the network connection, we're telling it how fast or slow our internet connection should be. This tool helps developers test their applications under a variety of internet connections that their users might experience.
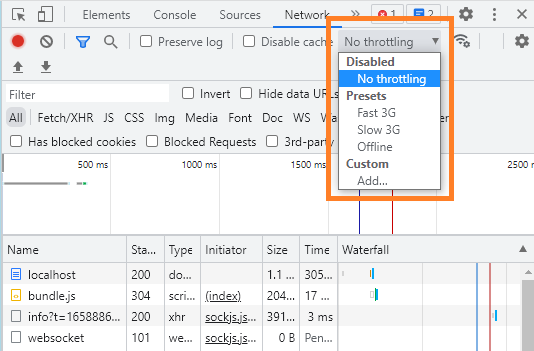
The default option is "no throttling", and at its most extreme we can tell our DevTools to make our webpage think it is offline. If we select offline and then submit our form to make an API call to the OpenWeather API, this simulates another type of error called a "network error".
With our XMLHttpRequest objects, our webpage will silently fail if we're offline. However, later on we'll learn how to use a tool called the Fetch API, which will return an error when there's a network error. But that's for another lesson!
For now, try throttling your network connection and refreshing the page — you'll see it takes much longer the more you throttle the connection.
Final Thoughts
And with that, we've covered the very basics of the DevTools Network tab. As mentioned previously, a lot of this information is similar to what you would find in Postman. While it's okay to favor one tool over the other, you should use and explore both tools to become familiar with each during this course section.
If you do ever find yourself adding a console.log() in your code to check out an API response object in the DevTools console, you should instead be using the DevTools Network tab.