📓 2.2.0.16 Improving Development with Source Maps for Debugging
How else can we improve our development experience? We can ensure that we are using source maps for debugging bundled code.
When we bundle our code and open it in the browser, any errors will refer to the bundle, not to our original source code. Since the bundle is minimized and very difficult to read, that makes it difficult to actually understand the errors. With source maps, we can trace the error back to our code, making it easier to debug.
Specifically, a source map connects code that's been compiled, minified, and bundled to the original source code. This allows us to get descriptive error messages. For example, without source maps, our error messages will point to our bundle.js, just like in the following image.
To cause the error, we introduced a typo into one of the parseInt() functions, calling it parsInt() instead. In our small Shape Tracker application, it won't be too big of a deal to locate the source of that issue based off of the message ReferenceError: parsInt is not defined. However, in a much bigger application, it could be a nightmare!
Other than unhelpful error messages, another big issue of debugging bundled code without a source map is that we can't add breakpoints to easily debug our code.
In the end, you should always use a source map when you are developing and debugging a bundled code base. For our code, we'll use the source mapping provided by our DevTools and webpack:
- We'll use DevTools source mapping in order to use breakpoints and
debugger;statements. - We'll use webpack source mapping in order to access optional configurations for source maps.
By the end of this lesson, you'll have configured webpack to use source maps!
Using DevTools Source Maps
The DevTools of all modern browsers offer built-in source maps. These source maps enable DevTools functionality like debugging with breakpoints and debugger; in the Sources tab. You can configure whether these are turned on or off, but the default configuration is on. As it should be!
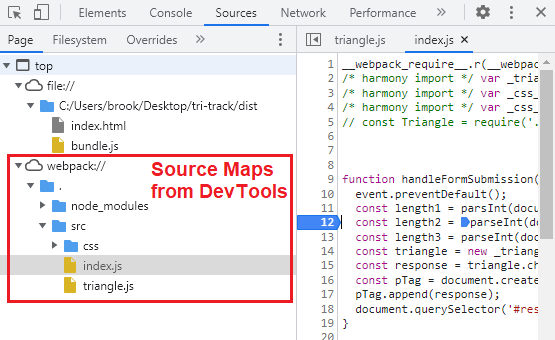
As long as we haven't specifically turned off source mapping (either in the browser or in our webpack.config.js), our DevTools will automatically generate a source map connecting the code in the bundle to our original source code. This means that we'll get descriptive error messages that point us to the exact line in our source code that's causing the error. And, we'll also be able to open the Sources panel in our DevTools, find a webpack directory with the source code inside, and set breakpoints in our source code. The image below demonstrates this.

If DevTools Source Mapping Works, Why Use webpack Source Maps?
The source mapping that DevTools provides should work in all of the cases that we'll need — to debug our business and user interface logic!
However, the DevTools source mapping won't always be able to generate source maps for our entire bundle without fail or further configuration. That's why it's good to also rely on the source mapping that webpack provides.
An example of where DevTools fails is with external style libraries (Bootstrap) when we bundle our code in production mode. And in this situation, we don't get a breaking error, but a warning. This case is highly specific and it's extremely likely that you won't run into this issue. Furthermore, we'll never be debugging Bootstrap directly.
Another reason to use webpack to configure source maps is to shape how they get generated, which includes the ability to not generate source maps or hide them. We won't be doing either of these in this course, but in short, we do need to learn the basic configurations for source mapping via webpack.
Using Built-In webpack Configuration Options for Source Maps
Setting up source maps for webpack is very straightforward. In the module.exports object, we'll add a new configuration option that's built-in to webpack. Go ahead and add this to your Shape Tracker project now.
...

module.exports = {
  entry: './src/index.js',
  output: {
    filename: 'bundle.js',
    path: path.resolve(__dirname, 'dist')
  },
  devtool: 'eval-source-map',  // new line

  ...

};
With devtool: 'eval-source-map', we've enabled webpack to generate source maps. Enabling this option will make our website load slower since there's more for our webpage to upload and process. This means we would not want to include this option when we create a build of our website for production.
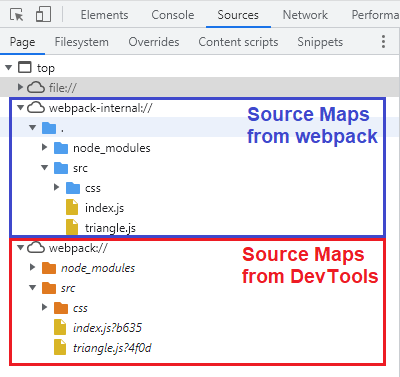
Now if we rebuild our our bundle and HTML with $ npm run build our project will have access to two sets of source maps. We can use both source maps to explore our code in DevTools, but we'll still only be able to set breakpoints in the source maps generated by our DevTools.

As noted previously, there are other configuration options for the devtool option in our webpack.config.js. The webpack docs list all of the available options, including how fast or slow they are, whether it's recommended for production, and other details about if and how the source code is changed. It's optional to review these options now, but if you are curious, visit the docs here:
In the next lesson, we'll add another great tool for development: a server to live reload a project created with webpack.